
 Margin Slippage Tests Bullish Earnings Growth Narrative")
CMS Energy (CMS) closed out FY 2025 with fourth quarter revenue of US$2,233 million and basic EPS of US$0.94, alongside net income excluding extra items of US$286 million. Trailing 12 month revenue stood at US$8.5 billion with EPS of US$3.52 and net income of US$1,061 million. The company has seen quarterly revenue move from US$1,989 million and EPS of US$0.88 in Q4 2024 to US$2,233 million and EPS of US$0.94 in Q4 2025, with trailing 12 month EPS shifting between US$3.33 and US$3.52 over the past six reported periods. With margins easing slightly over the last year and interest coverage highlighted as a weak spot, investors are likely to focus on how these results balance earnings growth potential, a 3.13% dividend and the pressure on profitability.
See our full analysis for CMS Energy.
With the numbers on the table, the next step is to see how this earnings story lines up against the widely followed narratives around CMS Energy’s growth outlook, income profile and risk factors.
Curious how numbers become stories that shape markets? Explore Community Narratives
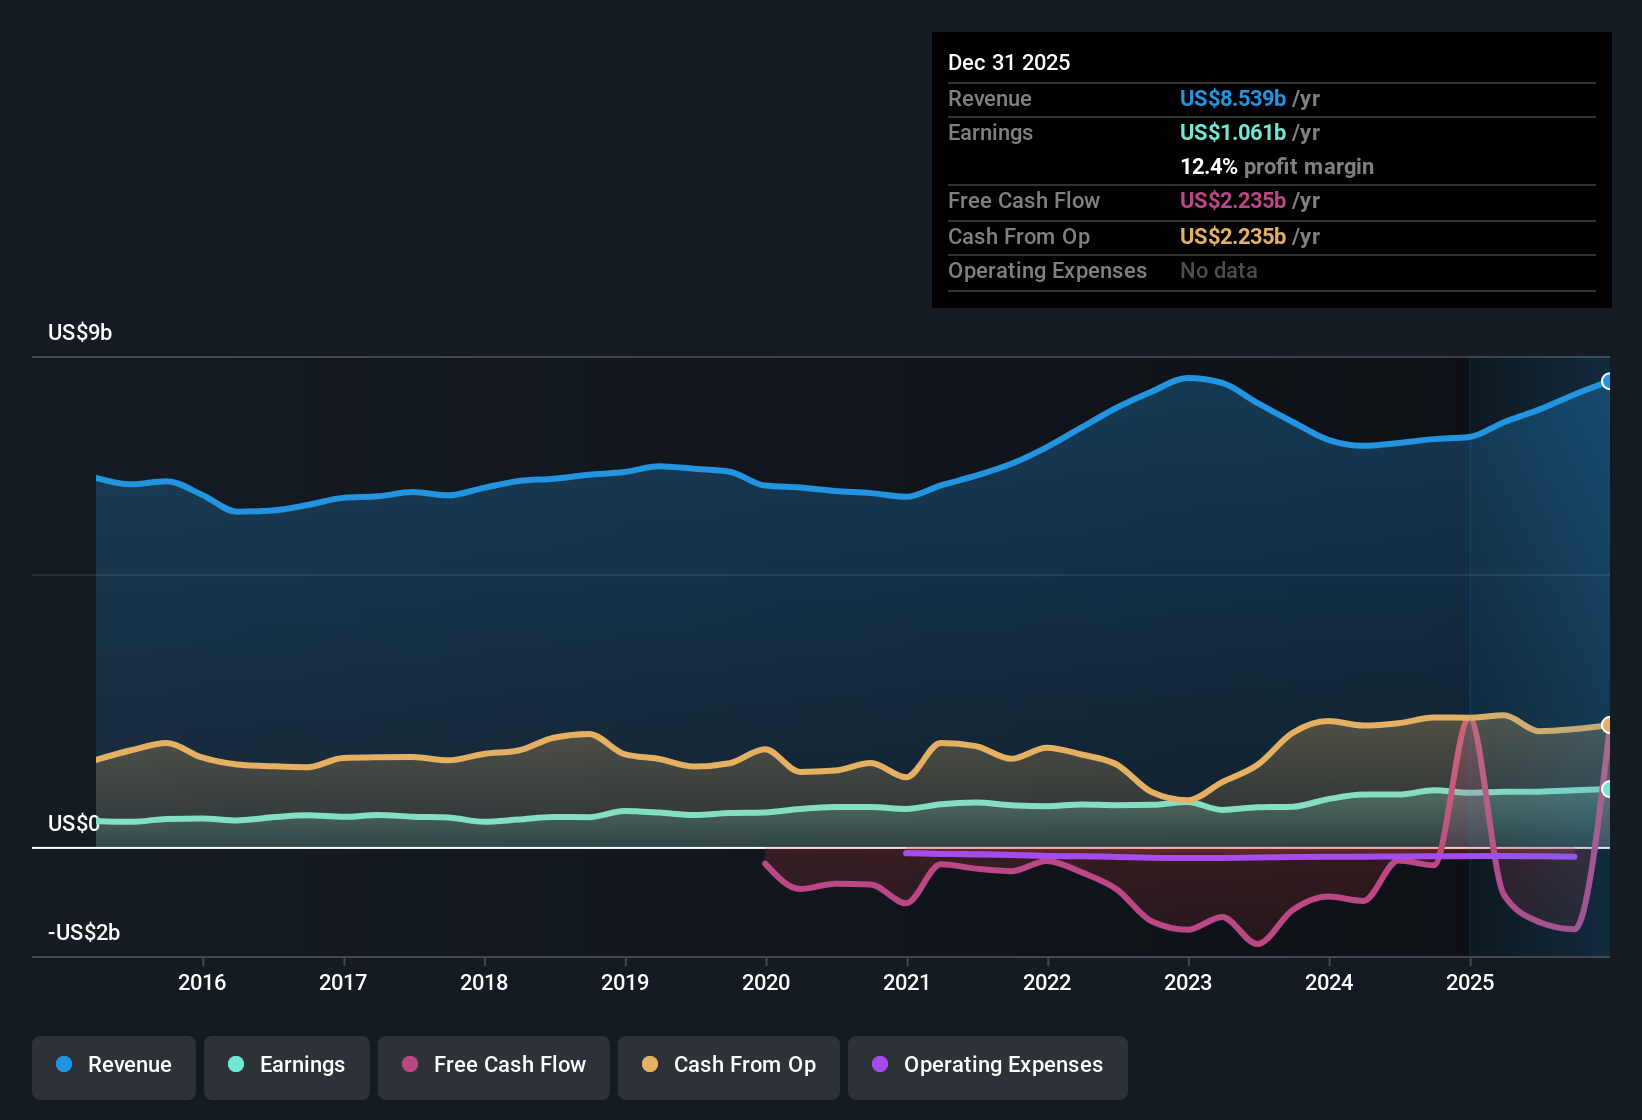 NYSE:CMS Earnings & Revenue History as at Feb 2026 12.4% net margin takes a step back
- CMS Energy converted US$8.5b of trailing revenue into US$1,061 million of net income, which works out to a 12.4% net profit margin compared with 13.2% a year earlier.
- What stands out for a more bullish view is that trailing EPS of US$3.52 and five year earnings growth of about 8.2% per year sit alongside that softer margin, so anyone leaning bullish has to explain how growth and a 12.4% margin can comfortably coexist with pressure on profitability.
Analysts watching this mix of mid single digit earnings growth, a slightly lower margin and ongoing capex needs are asking whether the long term story still looks as balanced as it did a year ago, or if profitability trends now matter more than headline growth forecasts. 📊 Read the full CMS Energy Consensus Narrative.
Dividend at 3.13% with earnings support
- On the trailing numbers, shareholders are collecting a 3.13% dividend yield alongside EPS of US$3.52 and net income of US$1,061 million, so current payouts are backed by the latest full year earnings base.
- Supporters of a more bullish stance often point to this income and growth mix, and the data here gives that view some weight but also clear limits:
- On the supportive side, reported earnings growth of about 9.7% per year and five year growth of roughly 8.2% per year sit alongside the 3.13% yield, so holders are not relying on income alone for their return profile.
- Balancing that, the slip in net margin from 13.2% to 12.4% means this income stream is coming from a slightly thinner profitability base, which bulls need to keep in mind when they talk about the dividend’s long term appeal.
Valuation and interest costs pull in opposite directions
- CMS Energy trades at US$72.84, a P/E of 20.9x, which sits above the 19.3x Global Integrated Utilities industry average but below the 22.3x peer average, and the price is also modestly above the US$70.05 DCF fair value estimate.
- Bears focus heavily on financing risk, and the figures here give them a clear talking point as well as something to debate:
- The analysis flags interest coverage as weak, with interest payments not well covered by earnings on a trailing basis, so higher debt servicing needs are an explicit pressure point rather than a theoretical concern.
- At the same time, the share price sitting close to the DCF fair value and only slightly above the wider industry P/E makes it hard to argue that the market is ignoring that risk entirely, which softens the strict bearish claim that the stock is priced as if financing were a non issue.
With that mix of valuation signals and balance sheet pressure, some investors are now checking how much of the story is about earnings growth versus the cost of carrying debt before they decide how comfortable they are with the current P/E and dividend profile.
Next Steps
Don’t just look at this quarter; the real story is in the long-term trend. We’ve done an in-depth analysis on CMS Energy’s growth and its valuation to see if today’s price is a bargain. Add the company to your watchlist or portfolio now so you don’t miss the next big move.
See What Else Is Out There
CMS Energy is working with a slightly thinner 12.4% net margin, weaker interest coverage and a share price that already sits close to its DCF estimate.
If that mix of margin pressure and financing risk feels a bit tight for your comfort, check out 86 resilient stocks with low risk scores to quickly zero in on companies with more resilient profiles.
This article by Simply Wall St is general in nature. We provide commentary based on historical data
and analyst forecasts only using an unbiased methodology and our articles are not intended to be financial advice. It does not constitute a recommendation to buy or sell any stock, and does not take account of your objectives, or your
financial situation. We aim to bring you long-term focused analysis driven by fundamental data.
Note that our analysis may not factor in the latest price-sensitive company announcements or qualitative material.
Simply Wall St has no position in any stocks mentioned.
Our new AI Stock Screener scans the market every day to uncover opportunities.
• Dividend Powerhouses (3%+ Yield)
• Undervalued Small Caps with Insider Buying
• High growth Tech and AI Companies
Or build your own from over 50 metrics.
Have feedback on this article? Concerned about the content? Get in touch with us directly. Alternatively, email editorial-team@simplywallst.com