

Feb 8, 2026
IndexBox has just published a new report: EU – Refined Groundnut Oil – Market Analysis, Forecast, Size, Trends And Insights.
The article provides a comprehensive analysis of the European Union’s refined groundnut oil market from 2013 to 2024, with forecasts to 2035. In 2024, the market consumed approximately 246K tons, valued at $828M, with Germany, France, and Italy being the largest consumers. Production was similar at 246K tons, led by the same countries. The market saw significant import growth in 2024 (17K tons, +61%), primarily driven by France, while exports contracted sharply (-25.6% to 17K tons), with Belgium as the leading exporter. The market is forecast to grow to 269K tons in volume and $1B in value by 2035, with CAGRs of +0.8% and +2.0%, respectively. The analysis includes detailed data on per capita consumption, import/export prices, and country-level breakdowns of trade and market dynamics.
Key Findings
- EU market forecast to grow to 269K tons and $1B by 2035, driven by sustained demand
- Germany, France, and Italy dominate consumption, accounting for 58% of the EU total
- 2024 imports surged 61% led by France, while exports fell sharply by 25.6%
- Production and consumption in 2024 were balanced at 246K tons but remain below 2017 peaks
- Significant price disparities exist in trade, with Spanish imports and German exports commanding the highest prices
Market Forecast
Driven by increasing demand for refined groundnut oil in the European Union, the market is expected to continue an upward consumption trend over the next decade. Market performance is forecast to retain its current trend pattern, expanding with an anticipated CAGR of +0.8% for the period from 2024 to 2035, which is projected to bring the market volume to 269K tons by the end of 2035.
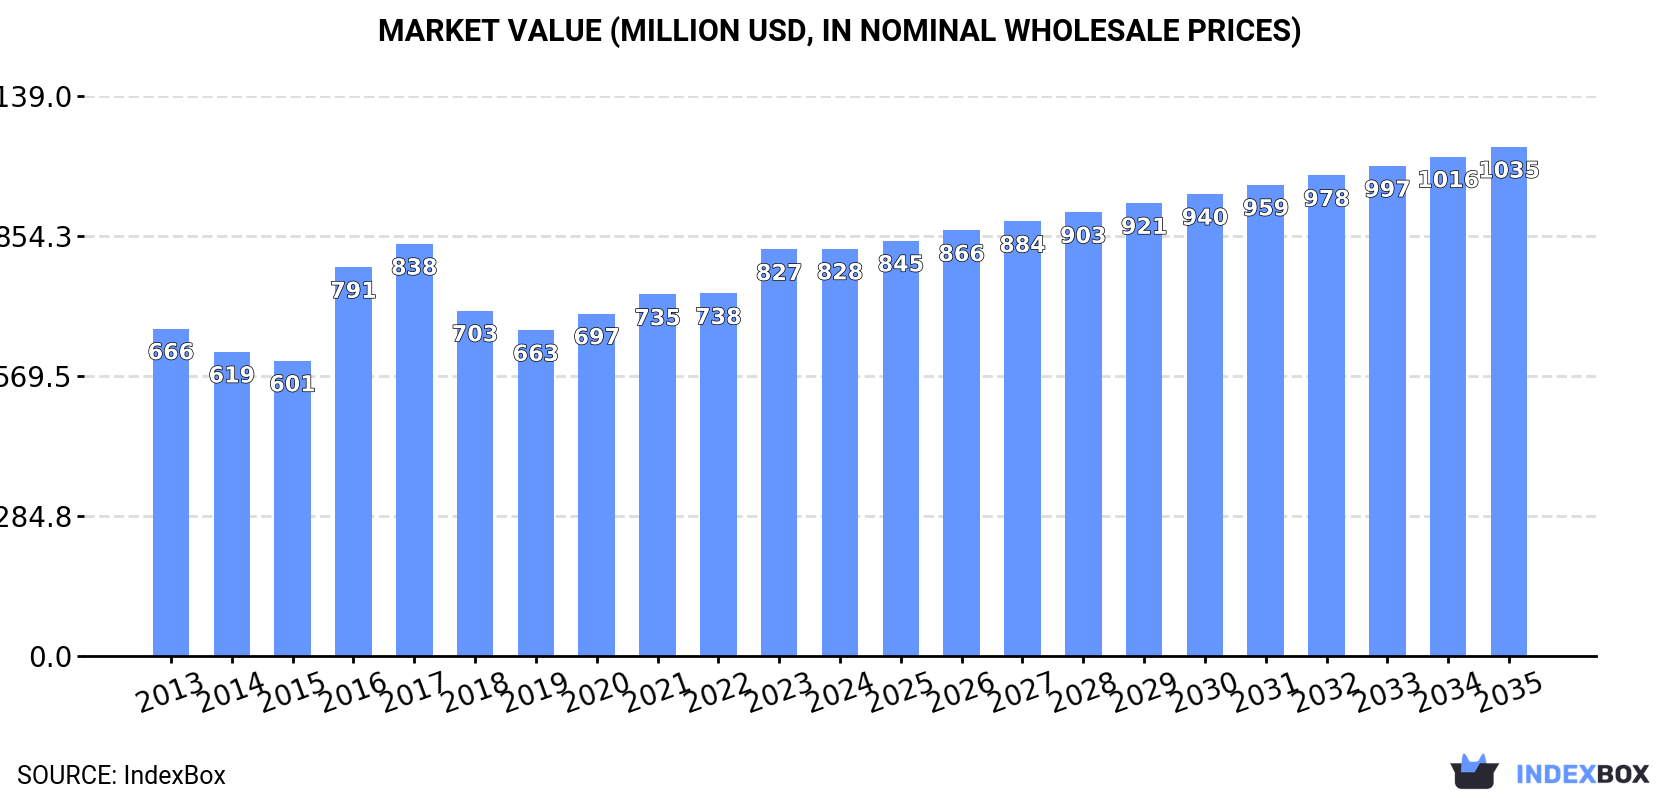
In value terms, the market is forecast to increase with an anticipated CAGR of +2.0% for the period from 2024 to 2035, which is projected to bring the market value to $1B (in nominal wholesale prices) by the end of 2035.
 ConsumptionEuropean Union’s Consumption of Refined Groundnut Oil
In 2024, approx. 246K tons of refined groundnut oil were consumed in the European Union; stabilizing at the previous year’s figure. Over the period under review, consumption, however, recorded a relatively flat trend pattern. The volume of consumption peaked at 316K tons in 2017; however, from 2018 to 2024, consumption failed to regain momentum.
The revenue of the refined groundnut oil market in the European Union totaled $828M in 2024, approximately mirroring the previous year. This figure reflects the total revenues of producers and importers (excluding logistics costs, retail marketing costs, and retailers’ margins, which will be included in the final consumer price). The market value increased at an average annual rate of +2.0% from 2013 to 2024; however, the trend pattern indicated some noticeable fluctuations being recorded throughout the analyzed period. The level of consumption peaked at $838M in 2017; however, from 2018 to 2024, consumption remained at a lower figure.
Consumption By Country
The countries with the highest volumes of consumption in 2024 were Germany (64K tons), France (46K tons) and Italy (34K tons), together comprising 58% of total consumption. Spain, Romania, the Netherlands, the Czech Republic, Portugal, Greece and Hungary lagged somewhat behind, together accounting for a further 28%.
From 2013 to 2024, the biggest increases were recorded for Hungary (with a CAGR of +1.6%), while consumption for the other leaders experienced more modest paces of growth.
In value terms, Germany ($271M) led the market, alone. The second position in the ranking was held by Spain ($129M). It was followed by France.
From 2013 to 2024, the average annual growth rate of value in Germany totaled +1.1%. In the other countries, the average annual rates were as follows: Spain (+6.2% per year) and France (+1.6% per year).
The countries with the highest levels of refined groundnut oil per capita consumption in 2024 were Germany (778 kg per 1000 persons), the Czech Republic (701 kg per 1000 persons) and Portugal (696 kg per 1000 persons).
From 2013 to 2024, the biggest increases were recorded for Romania (with a CAGR of +2.1%), while consumption for the other leaders experienced more modest paces of growth.
ProductionEuropean Union’s Production of Refined Groundnut Oil
Refined groundnut oil production contracted to 246K tons in 2024, reducing by -5.8% against the previous year. Over the period under review, production, however, recorded a relatively flat trend pattern. The most prominent rate of growth was recorded in 2016 with an increase of 31%. As a result, production reached the peak volume of 323K tons. From 2017 to 2024, production growth remained at a lower figure.
In value terms, refined groundnut oil production contracted slightly to $858M in 2024 estimated in export price. The total output value increased at an average annual rate of +2.3% over the period from 2013 to 2024; however, the trend pattern indicated some noticeable fluctuations being recorded throughout the analyzed period. The pace of growth was the most pronounced in 2016 when the production volume increased by 33% against the previous year. Over the period under review, production hit record highs at $885M in 2023, and then reduced in the following year.
Production By Country
The countries with the highest volumes of production in 2024 were Germany (63K tons), France (42K tons) and Italy (36K tons), with a combined 57% share of total production. Spain, Belgium, Romania, the Netherlands, Portugal, the Czech Republic and Greece lagged somewhat behind, together accounting for a further 30%.
From 2013 to 2024, the biggest increases were recorded for the Netherlands (with a CAGR of +2.4%), while production for the other leaders experienced more modest paces of growth.
ImportsEuropean Union’s Imports of Refined Groundnut Oil
Refined groundnut oil imports soared to 17K tons in 2024, increasing by 61% on the previous year. In general, imports, however, saw a mild downturn. The volume of import peaked at 20K tons in 2014; however, from 2015 to 2024, imports failed to regain momentum.
In value terms, refined groundnut oil imports surged to $43M in 2024. Over the period under review, imports, however, continue to indicate a relatively flat trend pattern. Over the period under review, imports hit record highs at $46M in 2013; however, from 2014 to 2024, imports remained at a lower figure.
Imports By Country
France was the main importing country with an import of around 6.8K tons, which resulted at 40% of total imports. The Netherlands (3.4K tons) took a 20% share (based on physical terms) of total imports, which put it in second place, followed by Germany (16%) and Belgium (4.7%). Spain (728 tons), Austria (678 tons), the Czech Republic (616 tons), Luxembourg (357 tons) and Slovenia (279 tons) followed a long way behind the leaders.
Imports into France increased at an average annual rate of +6.3% from 2013 to 2024. At the same time, the Czech Republic (+28.7%), Slovenia (+10.2%) and Austria (+2.6%) displayed positive paces of growth. Moreover, the Czech Republic emerged as the fastest-growing importer imported in the European Union, with a CAGR of +28.7% from 2013-2024. Luxembourg experienced a relatively flat trend pattern. By contrast, Spain (-1.1%), Germany (-3.9%), the Netherlands (-4.3%) and Belgium (-13.9%) illustrated a downward trend over the same period. While the share of France (+23 p.p.) and the Czech Republic (+3.4 p.p.) increased significantly in terms of the total imports from 2013-2024, the share of Germany (-5.1 p.p.), the Netherlands (-7.6 p.p.) and Belgium (-15.9 p.p.) displayed negative dynamics. The shares of the other countries remained relatively stable throughout the analyzed period.
In value terms, the largest refined groundnut oil importing markets in the European Union were France ($13M), the Netherlands ($9.5M) and Germany ($8M), with a combined 72% share of total imports. Spain, Belgium, Austria, Luxembourg, the Czech Republic and Slovenia lagged somewhat behind, together comprising a further 21%.
Among the main importing countries, the Czech Republic, with a CAGR of +18.9%, saw the highest rates of growth with regard to the value of imports, over the period under review, while purchases for the other leaders experienced more modest paces of growth.
Import Prices By Country
In 2024, the import price in the European Union amounted to $2,523 per ton, falling by -14.1% against the previous year. Overall, the import price, however, recorded a relatively flat trend pattern. The pace of growth was the most pronounced in 2021 an increase of 19% against the previous year. Over the period under review, import prices attained the maximum at $2,937 per ton in 2023, and then reduced in the following year.
There were significant differences in the average prices amongst the major importing countries. In 2024, amid the top importers, the country with the highest price was Spain ($3,398 per ton), while the Czech Republic ($1,413 per ton) was amongst the lowest.
From 2013 to 2024, the most notable rate of growth in terms of prices was attained by Spain (+7.0%), while the other leaders experienced more modest paces of growth.
ExportsEuropean Union’s Exports of Refined Groundnut Oil
In 2024, the amount of refined groundnut oil exported in the European Union contracted sharply to 17K tons, with a decrease of -25.6% compared with 2023 figures. Over the period under review, exports recorded a noticeable downturn. The growth pace was the most rapid in 2023 when exports increased by 27% against the previous year. The volume of export peaked at 25K tons in 2018; however, from 2019 to 2024, the exports stood at a somewhat lower figure.
In value terms, refined groundnut oil exports dropped dramatically to $49M in 2024. In general, exports saw a relatively flat trend pattern. The most prominent rate of growth was recorded in 2021 when exports increased by 41% against the previous year. Over the period under review, the exports hit record highs at $63M in 2023, and then fell notably in the following year.
Exports By Country
Belgium represented the largest exporter of refined groundnut oil in the European Union, with the volume of exports recording 7.8K tons, which was approx. 47% of total exports in 2024. France (2.8K tons) ranks second in terms of the total exports with a 17% share, followed by the Netherlands (14%), Italy (13%) and Germany (7.3%).
From 2013 to 2024, average annual rates of growth with regard to refined groundnut oil exports from Belgium stood at -3.3%. At the same time, Italy (+12.4%) and Germany (+9.7%) displayed positive paces of growth. Moreover, Italy emerged as the fastest-growing exporter exported in the European Union, with a CAGR of +12.4% from 2013-2024. By contrast, the Netherlands (-1.6%) and France (-6.1%) illustrated a downward trend over the same period. While the share of Italy (+10 p.p.) and Germany (+5.2 p.p.) increased significantly in terms of the total exports from 2013-2024, the share of Belgium (-5.9 p.p.) and France (-9.3 p.p.) displayed negative dynamics. The shares of the other countries remained relatively stable throughout the analyzed period.
In value terms, Belgium ($22M) remains the largest refined groundnut oil supplier in the European Union, comprising 44% of total exports. The second position in the ranking was held by France ($7.3M), with a 15% share of total exports. It was followed by the Netherlands, with a 14% share.
In Belgium, refined groundnut oil exports decreased by an average annual rate of -1.9% over the period from 2013-2024. In the other countries, the average annual rates were as follows: France (-5.3% per year) and the Netherlands (+1.2% per year).
Export Prices By Country
In 2024, the export price in the European Union amounted to $2,960 per ton, with an increase of 4.7% against the previous year. Export price indicated a slight expansion from 2013 to 2024: its price increased at an average annual rate of +1.8% over the last eleven years. The trend pattern, however, indicated some noticeable fluctuations being recorded throughout the analyzed period. Based on 2024 figures, refined groundnut oil export price increased by +57.4% against 2019 indices. The growth pace was the most rapid in 2021 when the export price increased by 19% against the previous year. The level of export peaked in 2024 and is expected to retain growth in the near future.
Prices varied noticeably by country of origin: amid the top suppliers, the country with the highest price was Germany ($4,571 per ton), while France ($2,634 per ton) was amongst the lowest.
From 2013 to 2024, the most notable rate of growth in terms of prices was attained by the Netherlands (+2.8%), while the other leaders experienced more modest paces of growth.
This report provides a comprehensive view of the refined groundnut oil industry in European Union, tracking demand, supply, and trade flows across the regional value chain. It explains how demand across key channels and end-use segments shapes consumption patterns, while also mapping the role of input availability, production efficiency, and regulatory standards on supply.
Beyond headline metrics, the study benchmarks prices, margins, and trade routes so you can see where value is created and how it moves between exporters and importers within European Union. The analysis is designed to support strategic planning, market entry, portfolio prioritization, and risk management in the refined groundnut oil landscape in European Union.
Quick navigation
Key findings
- Regional demand is shaped by both household and industrial usage, with trade flows linking supply hubs to import-reliant countries.
- Pricing dynamics reflect unit values, freight costs, exchange rates, and regulatory shifts that affect sourcing decisions.
- Supply depends on input availability and production efficiency, creating distinct cost curves across European Union.
- Market concentration varies by country, creating different competitive landscapes and entry barriers.
- The 2035 outlook highlights where capacity investment and demand growth are most aligned within the region.
Report scope
The report combines market sizing with trade intelligence and price analytics for European Union. It covers both historical performance and the forward outlook to 2035, allowing you to compare cycles, structural shifts, and policy impacts across countries and sub-regions.
- Market size and growth in value and volume terms
- Consumption structure by end-use segments and countries
- Production capacity, output, and cost dynamics
- Regional trade flows, exporters, importers, and balances
- Price benchmarks, unit values, and margin signals
- Competitive context and market entry conditions
Product coverage
- Prodcom 10415200 – Refined groundnut oil and its fractions (excluding chemically modified)
Country coverageCountry profiles and benchmarks
For the regional report, country profiles provide a consistent view of market size, trade balance, prices, and per-capita indicators across European Union. The profiles highlight the largest consuming and producing markets and allow direct benchmarking across peers.
Methodology
The analysis is built on a multi-source framework that combines official statistics, trade records, company disclosures, and expert validation. Data are standardized, reconciled, and cross-checked to ensure consistency across time series.
- International trade data (exports, imports, and mirror statistics)
- National production and consumption statistics
- Company-level information from financial filings and public releases
- Price series and unit value benchmarks
- Analyst review, outlier checks, and time-series validation
All data are normalized to a common product definition and mapped to a consistent set of codes. This ensures that comparisons across time are aligned and actionable.
Forecasts to 2035
The forecast horizon extends to 2035 and is based on a structured model that links refined groundnut oil demand and supply to macroeconomic indicators, trade patterns, and sector-specific drivers. The model captures both cyclical and structural factors and reflects known policy and technology shifts within European Union.
- Historical baseline: 2012-2025
- Forecast horizon: 2026-2035
- Scenario-based sensitivity to income growth, substitution, and regulation
- Capacity and investment outlook for major producing countries
Each country projection is built from its own historical pattern and the regional context, allowing the report to show where growth is concentrated and where risks are elevated.
Price analysis and trade dynamics
Prices are analyzed in detail, including export and import unit values, regional spreads, and changes in trade costs. The report highlights how seasonality, freight rates, exchange rates, and supply disruptions influence pricing and margins.
- Price benchmarks by country and sub-region
- Export and import unit value trends
- Seasonality and calendar effects in trade flows
- Price outlook to 2035 under baseline assumptions
Profiles of market participants
Key producers, exporters, and distributors are profiled with a focus on their operational scale, geographic footprint, product mix, and market positioning. This helps identify competitive pressure points, partnership opportunities, and routes to differentiation.
- Business focus and production capabilities
- Geographic reach and distribution networks
- Cost structure and pricing strategy indicators
- Compliance, certification, and sustainability context
How to use this report
- Quantify regional demand and identify the most attractive country markets
- Evaluate export opportunities and prioritize target destinations
- Track price dynamics and protect margins
- Benchmark performance against regional competitors
- Build evidence-based forecasts for investment decisions
This report is designed for manufacturers, distributors, importers, wholesalers, investors, and advisors who need a clear, data-driven picture of refined groundnut oil dynamics in European Union.
FAQ
What is included in the refined groundnut oil market in European Union?
The market size aggregates consumption and trade data at country and sub-regional levels, presented in both value and volume terms.
How are the forecasts to 2035 built?
The projections combine historical trends with macroeconomic indicators, trade dynamics, and sector-specific drivers.
Does the report cover prices and margins?
Yes, it includes export and import unit values, regional spreads, and a pricing outlook to 2035.
Which countries are profiled in detail?
The report provides profiles for the largest consuming and producing countries in European Union.
Can this report support market entry decisions?
Yes, it highlights demand hotspots, trade routes, pricing trends, and competitive context.