

Feb 11, 2026
IndexBox has just published a new report: EU – Mechanical Wood Pulp – Market Analysis, Forecast, Size, Trends and Insights.
The article provides a comprehensive analysis of the European Union’s mechanical wood pulp market from 2013 to 2024, with a forecast to 2035. It details that after a period of decline, consumption rose to 3.8M tons in 2024, with a market value of $2.1B. The market is forecast to grow to 4.2M tons (volume) and $2.6B (value) by 2035. Sweden, Germany, and Finland are the largest consuming and producing countries. While intra-EU trade has contracted recently, Slovenia and Denmark have shown notable growth in consumption and import value, respectively. The analysis covers production, consumption by country, per capita figures, and import/export dynamics including prices.
Key Findings
- EU mechanical wood pulp market is forecast to grow to 4.2M tons and $2.6B by 2035 after recent stagnation
- Sweden, Germany, and Finland dominate consumption and production, accounting for 45% of the total market
- Slovenia recorded the fastest growth in both per capita consumption and production volume from 2013-2024
- Intra-EU imports and exports have declined significantly since their peaks, falling to 118K tons and 151K tons in 2024, respectively
- Denmark achieved the highest growth rate in import value, while Sweden had the highest average export price in 2024
Market Forecast
Driven by rising demand for mechanical wood pulp in the European Union, the market is expected to start an upward consumption trend over the next decade. The performance of the market is forecast to increase slightly, with an anticipated CAGR of +0.9% for the period from 2024 to 2035, which is projected to bring the market volume to 4.2M tons by the end of 2035.
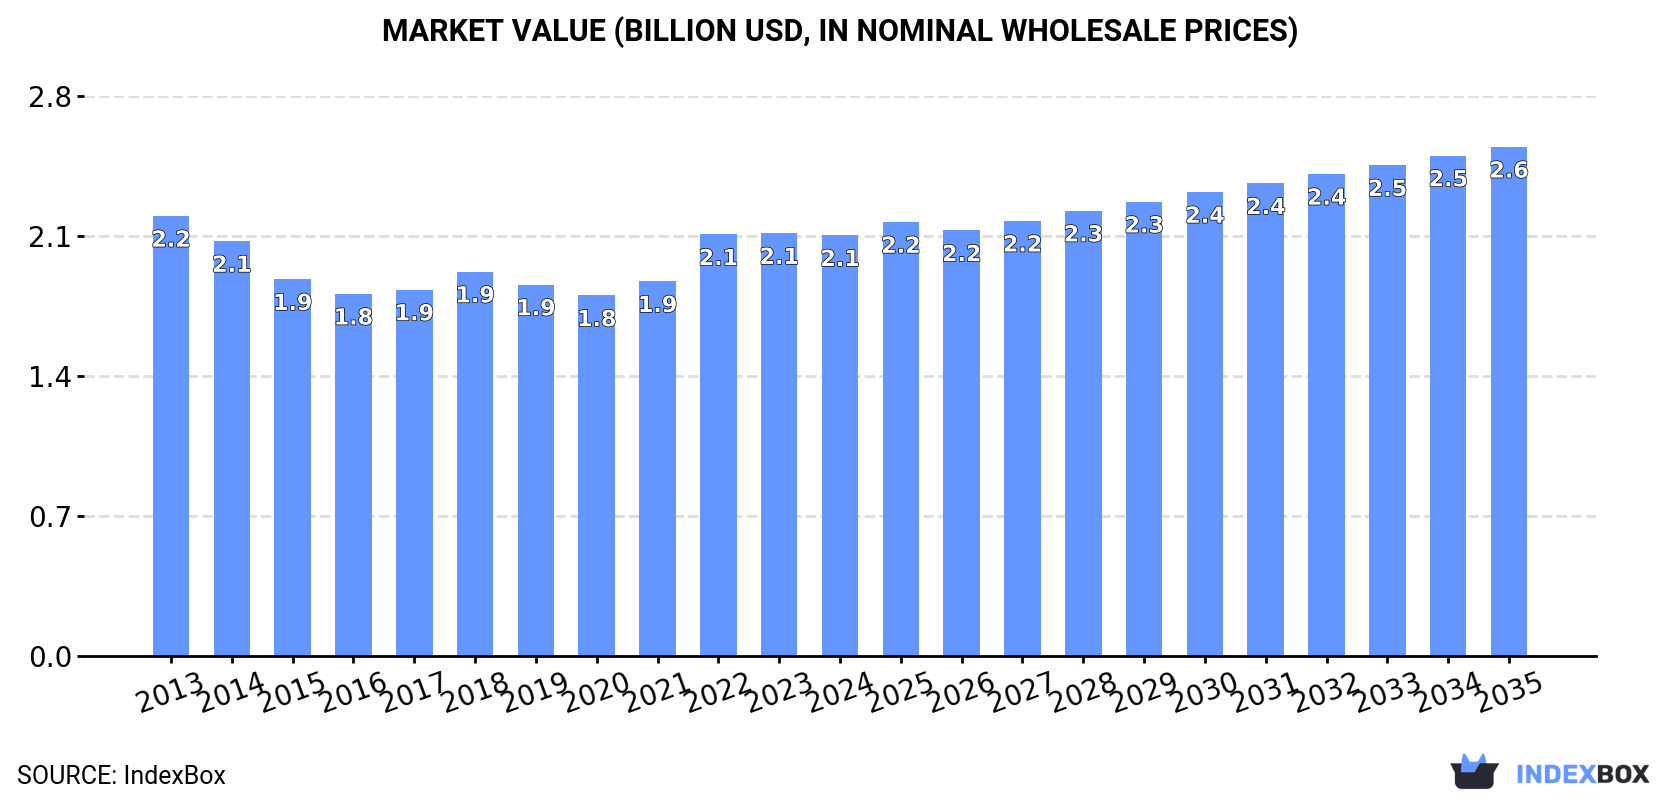
In value terms, the market is forecast to increase with an anticipated CAGR of +1.7% for the period from 2024 to 2035, which is projected to bring the market value to $2.6B (in nominal wholesale prices) by the end of 2035.
 ConsumptionEuropean Union’s Consumption of Mechanical Wood Pulp
In 2024, consumption of mechanical wood pulp was finally on the rise to reach 3.8M tons for the first time since 2019, thus ending a four-year declining trend. In general, consumption, however, continues to indicate a mild decrease. The pace of growth was the most pronounced in 2019 with an increase of 1.1% against the previous year. Over the period under review, consumption reached the peak volume at 4.4M tons in 2013; however, from 2014 to 2024, consumption remained at a lower figure.
The size of the mechanical wood pulp market in the European Union reduced slightly to $2.1B in 2024, flattening at the previous year. This figure reflects the total revenues of producers and importers (excluding logistics costs, retail marketing costs, and retailers’ margins, which will be included in the final consumer price). Overall, consumption, however, showed a relatively flat trend pattern. Over the period under review, the market attained the peak level at $2.2B in 2013; however, from 2014 to 2024, consumption remained at a lower figure.
Consumption By Country
The countries with the highest volumes of consumption in 2024 were Sweden (604K tons), Germany (598K tons) and Finland (501K tons), with a combined 45% share of total consumption. Austria, the Netherlands, Romania, Portugal, Greece, Hungary and Slovenia lagged somewhat behind, together accounting for a further 38%.
From 2013 to 2024, the biggest increases were recorded for Slovenia (with a CAGR of +4.6%), while consumption for the other leaders experienced more modest paces of growth.
In value terms, the largest mechanical wood pulp markets in the European Union were Sweden ($402M), Germany ($284M) and Finland ($278M), together accounting for 45% of the total market.
Among the main consuming countries, Sweden, with a CAGR of +6.2%, recorded the highest rates of growth with regard to market size over the period under review, while market for the other leaders experienced more modest paces of growth.
The countries with the highest levels of mechanical wood pulp per capita consumption in 2024 were Finland (90 kg per person), Slovenia (57 kg per person) and Sweden (57 kg per person).
From 2013 to 2024, the most notable rate of growth in terms of consumption, amongst the main consuming countries, was attained by Slovenia (with a CAGR of +4.4%), while consumption for the other leaders experienced more modest paces of growth.
ProductionEuropean Union’s Production of Mechanical Wood Pulp
In 2024, production of mechanical wood pulp increased by 0.8% to 3.9M tons for the first time since 2021, thus ending a two-year declining trend. Overall, production, however, showed a mild shrinkage. The volume of production peaked at 4.3M tons in 2013; however, from 2014 to 2024, production stood at a somewhat lower figure.
In value terms, mechanical wood pulp production declined to $2.2B in 2024 estimated in export price. In general, production, however, continues to indicate a relatively flat trend pattern. The most prominent rate of growth was recorded in 2021 when the production volume increased by 32%. The level of production peaked at $2.4B in 2013; however, from 2014 to 2024, production failed to regain momentum.
Production By Country
The countries with the highest volumes of production in 2024 were Germany (630K tons), Sweden (604K tons) and Finland (502K tons), with a combined 45% share of total production. Austria, the Netherlands, Romania, Portugal, Greece, Hungary and Slovenia lagged somewhat behind, together accounting for a further 38%.
From 2013 to 2024, the biggest increases were recorded for Slovenia (with a CAGR of +5.0%), while production for the other leaders experienced more modest paces of growth.
ImportsEuropean Union’s Imports of Mechanical Wood Pulp
In 2024, purchases abroad of mechanical wood pulp decreased by -23.2% to 118K tons, falling for the fourth consecutive year after four years of growth. Overall, imports continue to indicate a deep reduction. The most prominent rate of growth was recorded in 2017 with an increase of 31% against the previous year. The volume of import peaked at 277K tons in 2013; however, from 2014 to 2024, imports stood at a somewhat lower figure.
In value terms, mechanical wood pulp imports fell rapidly to $73M in 2024. In general, imports continue to indicate a deep setback. The most prominent rate of growth was recorded in 2017 with an increase of 38%. The level of import peaked at $145M in 2013; however, from 2014 to 2024, imports failed to regain momentum.
Imports By Country
In 2024, Denmark (25K tons), Italy (24K tons), Germany (18K tons), France (17K tons) and Sweden (14K tons) was the largest importer of mechanical wood pulp in the European Union, achieving 82% of total import. Poland (4.3K tons) and Austria (3.1K tons) followed a long way behind the leaders.
From 2013 to 2024, the most notable rate of growth in terms of purchases, amongst the leading importing countries, was attained by Denmark (with a CAGR of +15.0%), while imports for the other leaders experienced mixed trends in the imports figures.
In value terms, the largest mechanical wood pulp importing markets in the European Union were Denmark ($15M), Italy ($14M) and Germany ($11M), with a combined 55% share of total imports.
Denmark, with a CAGR of +18.5%, saw the highest growth rate of the value of imports, in terms of the main importing countries over the period under review, while purchases for the other leaders experienced mixed trends in the imports figures.
Import Prices By Country
The import price in the European Union stood at $619 per ton in 2024, approximately mirroring the previous year. Over the period from 2013 to 2024, it increased at an average annual rate of +1.5%. The most prominent rate of growth was recorded in 2018 an increase of 17% against the previous year. The level of import peaked in 2024 and is likely to continue growth in years to come.
Average prices varied somewhat amongst the major importing countries. In 2024, major importing countries recorded the following prices: in France ($658 per ton) and Sweden ($645 per ton), while Austria ($510 per ton) and Poland ($556 per ton) were amongst the lowest.
From 2013 to 2024, the most notable rate of growth in terms of prices was attained by Sweden (+3.1%), while the other leaders experienced more modest paces of growth.
ExportsEuropean Union’s Exports of Mechanical Wood Pulp
In 2024, overseas shipments of mechanical wood pulp decreased by -17.6% to 151K tons, falling for the third consecutive year after five years of growth. Over the period under review, exports showed a perceptible shrinkage. The most prominent rate of growth was recorded in 2020 with an increase of 28%. The volume of export peaked at 305K tons in 2021; however, from 2022 to 2024, the exports stood at a somewhat lower figure.
In value terms, mechanical wood pulp exports reduced dramatically to $88M in 2024. Overall, exports recorded a pronounced slump. The most prominent rate of growth was recorded in 2020 when exports increased by 25%. Over the period under review, the exports reached the peak figure at $159M in 2022; however, from 2023 to 2024, the exports failed to regain momentum.
Exports By Country
In 2024, Germany (50K tons), distantly followed by Croatia (32K tons), the Netherlands (17K tons), Spain (15K tons), Denmark (14K tons) and Sweden (14K tons) were the key exporters of mechanical wood pulp, together comprising 94% of total exports. France (3.2K tons) took a minor share of total exports.
From 2013 to 2024, the most notable rate of growth in terms of shipments, amongst the leading exporting countries, was attained by Denmark (with a CAGR of +246.0%), while the other leaders experienced more modest paces of growth.
In value terms, the largest mechanical wood pulp supplying countries in the European Union were Germany ($29M), Croatia ($17M) and Sweden ($9.5M), with a combined 63% share of total exports. The Netherlands, Spain, Denmark and France lagged somewhat behind, together comprising a further 33%.
Denmark, with a CAGR of +140.6%, recorded the highest growth rate of the value of exports, among the main exporting countries over the period under review, while shipments for the other leaders experienced more modest paces of growth.
Export Prices By Country
In 2024, the export price in the European Union amounted to $579 per ton, almost unchanged from the previous year. Export price indicated slight growth from 2013 to 2024: its price increased at an average annual rate of +1.1% over the last eleven years. The trend pattern, however, indicated some noticeable fluctuations being recorded throughout the analyzed period. Based on 2024 figures, mechanical wood pulp export price increased by +47.5% against 2016 indices. The growth pace was the most rapid in 2022 when the export price increased by 28%. The level of export peaked at $584 per ton in 2023, and then shrank slightly in the following year.
Average prices varied somewhat amongst the major exporting countries. In 2024, major exporting countries recorded the following prices: in Sweden ($689 per ton) and Spain ($617 per ton), while France ($481 per ton) and Croatia ($533 per ton) were amongst the lowest.
From 2013 to 2024, the most notable rate of growth in terms of prices was attained by France (+3.6%), while the other leaders experienced more modest paces of growth.
This report provides a comprehensive view of the mechanical wood pulp industry in European Union, tracking demand, supply, and trade flows across the regional value chain. It explains how demand across key channels and end-use segments shapes consumption patterns, while also mapping the role of input availability, production efficiency, and regulatory standards on supply.
Beyond headline metrics, the study benchmarks prices, margins, and trade routes so you can see where value is created and how it moves between exporters and importers within European Union. The analysis is designed to support strategic planning, market entry, portfolio prioritization, and risk management in the mechanical wood pulp landscape in European Union.
Quick navigation
Key findings
- Regional demand is shaped by both household and industrial usage, with trade flows linking supply hubs to import-reliant countries.
- Pricing dynamics reflect unit values, freight costs, exchange rates, and regulatory shifts that affect sourcing decisions.
- Supply depends on input availability and production efficiency, creating distinct cost curves across European Union.
- Market concentration varies by country, creating different competitive landscapes and entry barriers.
- The 2035 outlook highlights where capacity investment and demand growth are most aligned within the region.
Report scope
The report combines market sizing with trade intelligence and price analytics for European Union. It covers both historical performance and the forward outlook to 2035, allowing you to compare cycles, structural shifts, and policy impacts across countries and sub-regions.
- Market size and growth in value and volume terms
- Consumption structure by end-use segments and countries
- Production capacity, output, and cost dynamics
- Regional trade flows, exporters, importers, and balances
- Price benchmarks, unit values, and margin signals
- Competitive context and market entry conditions
Product coverage
- FCL 1654 – Mechanical wood pulp
Country coverageCountry profiles and benchmarks
For the regional report, country profiles provide a consistent view of market size, trade balance, prices, and per-capita indicators across European Union. The profiles highlight the largest consuming and producing markets and allow direct benchmarking across peers.
Methodology
The analysis is built on a multi-source framework that combines official statistics, trade records, company disclosures, and expert validation. Data are standardized, reconciled, and cross-checked to ensure consistency across time series.
- International trade data (exports, imports, and mirror statistics)
- National production and consumption statistics
- Company-level information from financial filings and public releases
- Price series and unit value benchmarks
- Analyst review, outlier checks, and time-series validation
All data are normalized to a common product definition and mapped to a consistent set of codes. This ensures that comparisons across time are aligned and actionable.
Forecasts to 2035
The forecast horizon extends to 2035 and is based on a structured model that links mechanical wood pulp demand and supply to macroeconomic indicators, trade patterns, and sector-specific drivers. The model captures both cyclical and structural factors and reflects known policy and technology shifts within European Union.
- Historical baseline: 2012-2025
- Forecast horizon: 2026-2035
- Scenario-based sensitivity to income growth, substitution, and regulation
- Capacity and investment outlook for major producing countries
Each country projection is built from its own historical pattern and the regional context, allowing the report to show where growth is concentrated and where risks are elevated.
Price analysis and trade dynamics
Prices are analyzed in detail, including export and import unit values, regional spreads, and changes in trade costs. The report highlights how seasonality, freight rates, exchange rates, and supply disruptions influence pricing and margins.
- Price benchmarks by country and sub-region
- Export and import unit value trends
- Seasonality and calendar effects in trade flows
- Price outlook to 2035 under baseline assumptions
Profiles of market participants
Key producers, exporters, and distributors are profiled with a focus on their operational scale, geographic footprint, product mix, and market positioning. This helps identify competitive pressure points, partnership opportunities, and routes to differentiation.
- Business focus and production capabilities
- Geographic reach and distribution networks
- Cost structure and pricing strategy indicators
- Compliance, certification, and sustainability context
How to use this report
- Quantify regional demand and identify the most attractive country markets
- Evaluate export opportunities and prioritize target destinations
- Track price dynamics and protect margins
- Benchmark performance against regional competitors
- Build evidence-based forecasts for investment decisions
This report is designed for manufacturers, distributors, importers, wholesalers, investors, and advisors who need a clear, data-driven picture of mechanical wood pulp dynamics in European Union.
FAQ
What is included in the mechanical wood pulp market in European Union?
The market size aggregates consumption and trade data at country and sub-regional levels, presented in both value and volume terms.
How are the forecasts to 2035 built?
The projections combine historical trends with macroeconomic indicators, trade dynamics, and sector-specific drivers.
Does the report cover prices and margins?
Yes, it includes export and import unit values, regional spreads, and a pricing outlook to 2035.
Which countries are profiled in detail?
The report provides profiles for the largest consuming and producing countries in European Union.
Can this report support market entry decisions?
Yes, it highlights demand hotspots, trade routes, pricing trends, and competitive context.