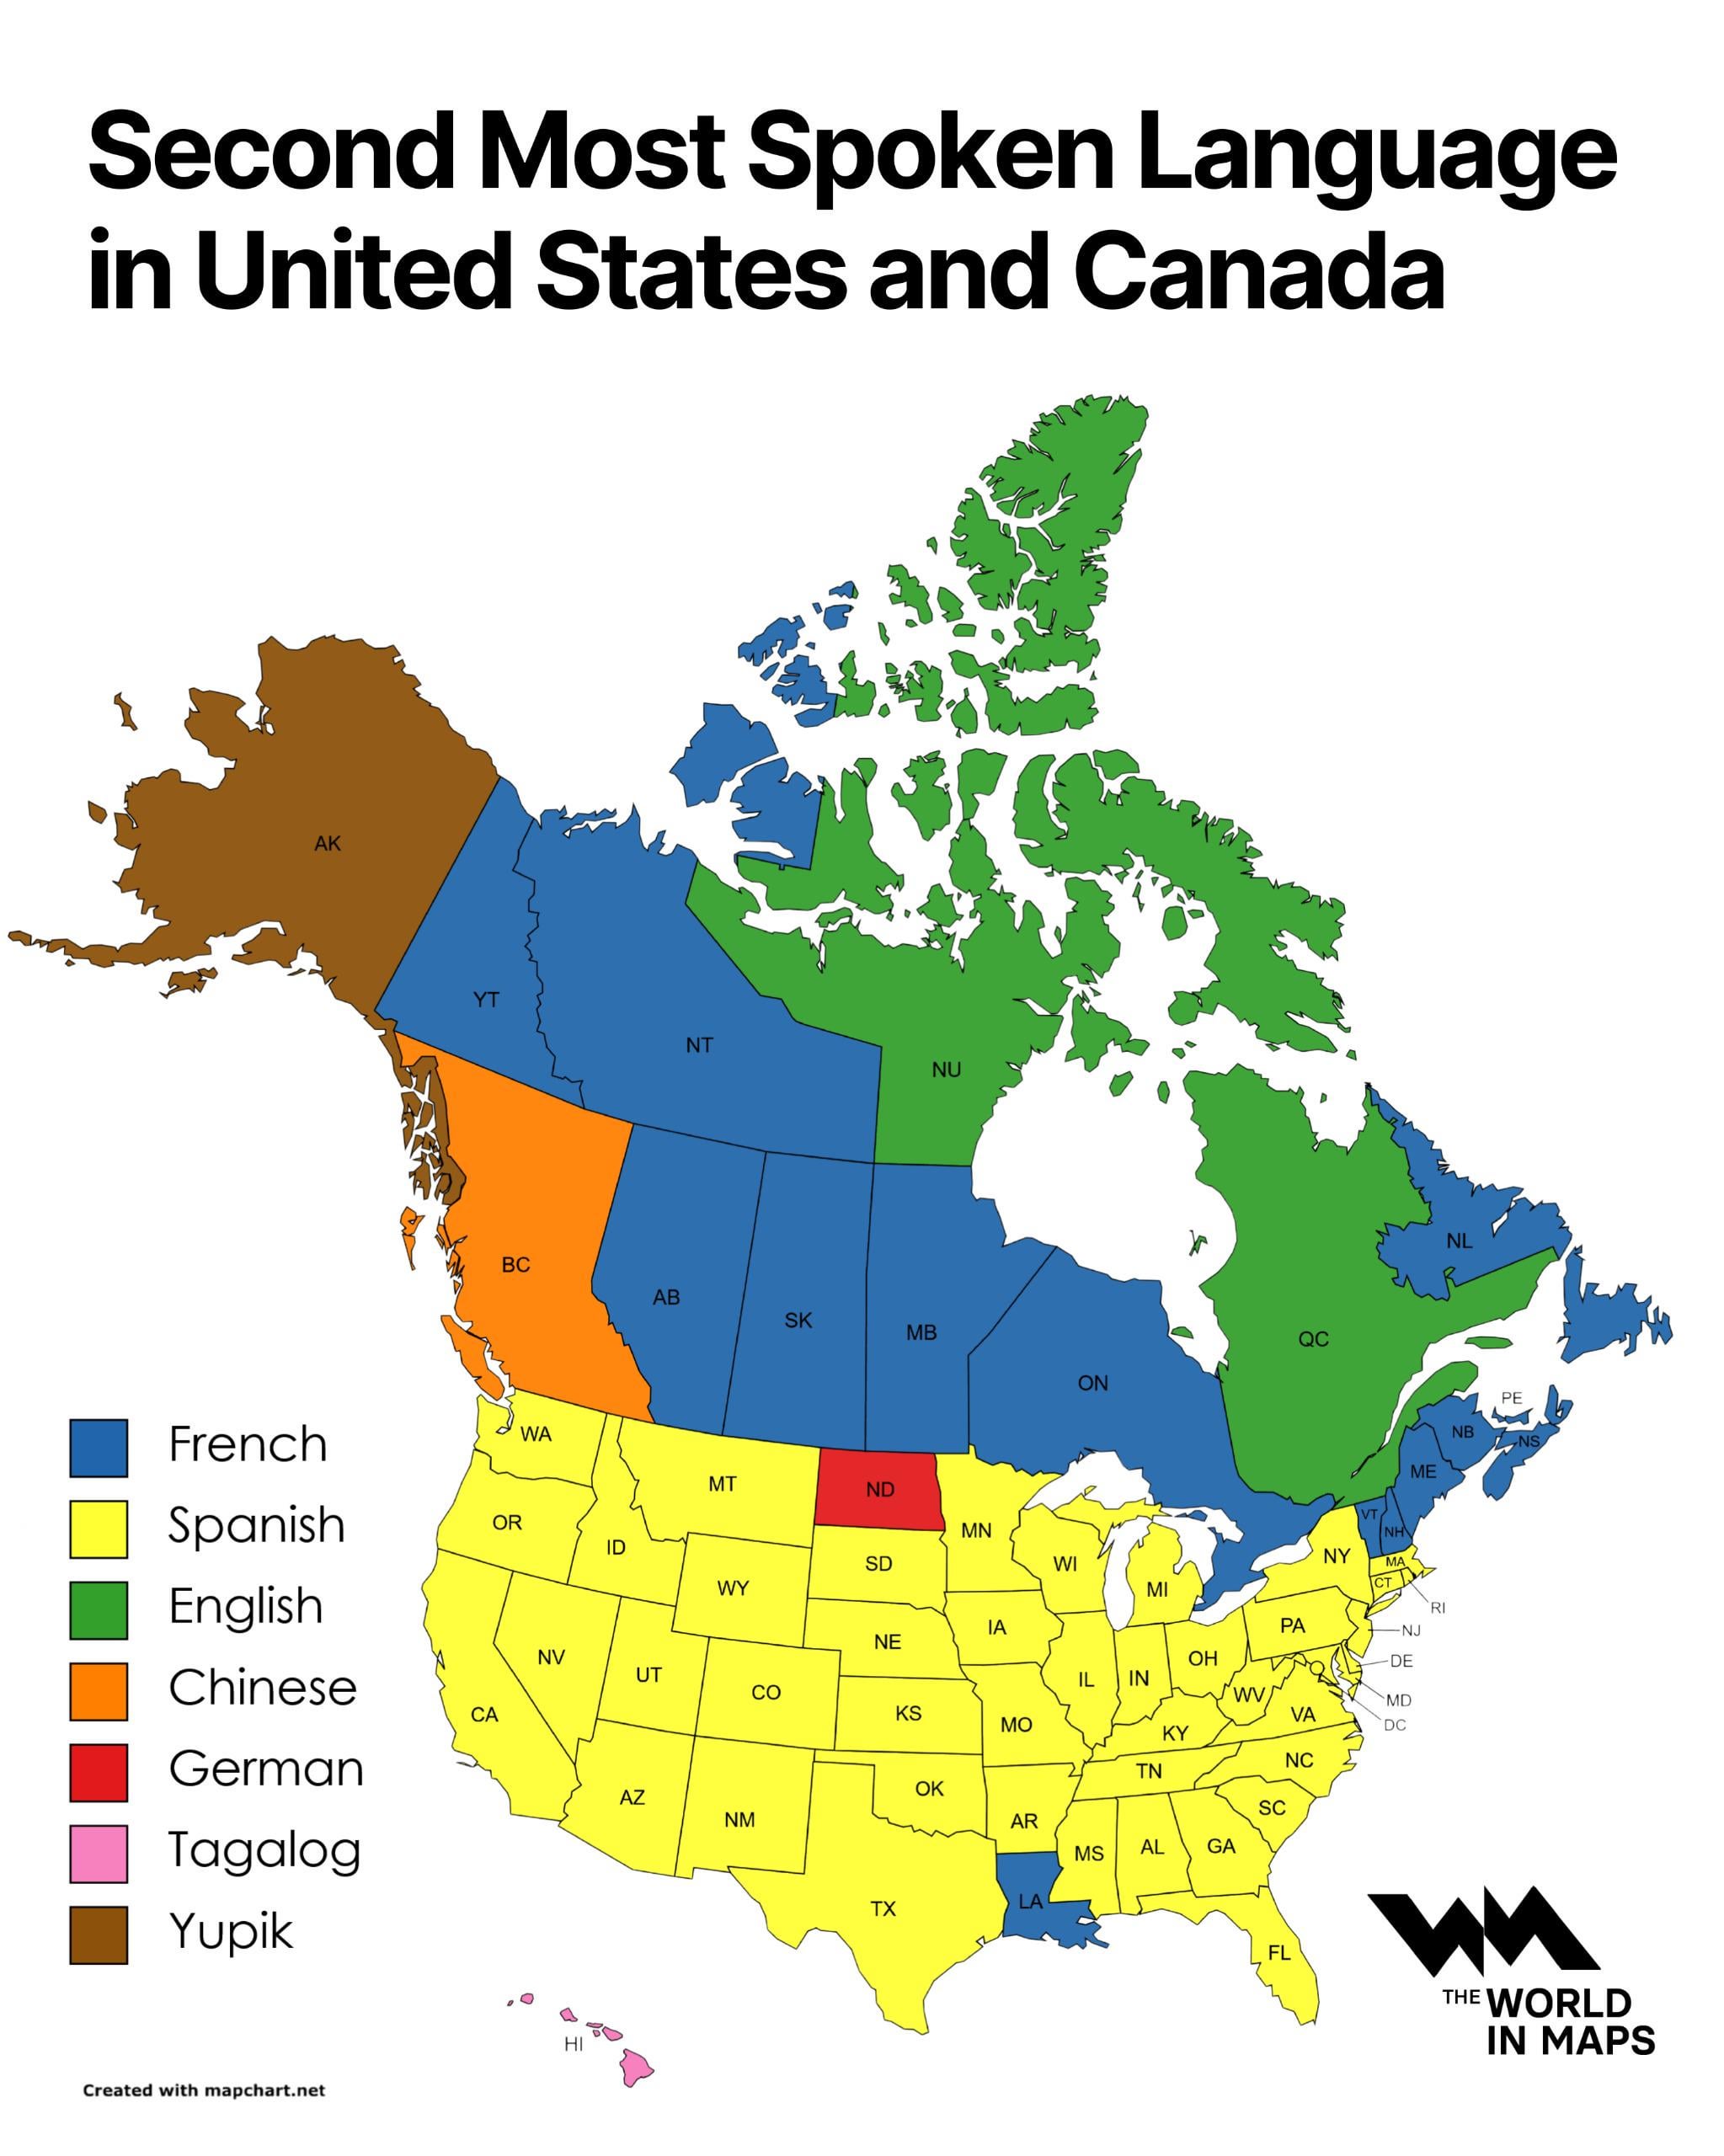
As a Louisiana native I hear Spanish spoken everyday in public. I’ve never heard French.
GTAIVisbest on
Who TF is speaking French in Louisiana? This map must be from 1937 or something
grownask on
This type of map has been posted so so so many times and everytime it gets corrected in comments that French isn’t the second most spoken language in Louisiana for years. It’s also Spanish.
hbhfl on
its not a shift with language, and those are immigrants who will ultimately assimilate and speak english like everybody here
stlthy1 on
LoL…. Creole isn’t French
LupusDeusMagnus on
According to the US Census of 2020, the non-English language breakdown of;
ND state is:
Most Common Non-English Languages
1. Spanish 14,612 households (2.01%)
2. German 4,605 households (0.633%)
3. Other Native Languages of North America 2,630 households (0.361%)
For HI I couldn’t find data breaking down the top languages:
Most Common Non-English Languages
1. Ilocano, Samoan, Hawaiian, or Other Austronesian Languages 122,558 households (8.99%)
2. Tagalog (Incl. Filipino) 59,329 households (4.35%)
3. Japanese 37,041 households (2.72%)
[deleted] on
[deleted]
tatar1warlord on
christian english colonizer language: 😍
christian spanish colonizer language: 🤬
TexasPeteGT on
Ooh, I get to decide for Alaska?? I pik Flemish
The_Oregon_Duck on
Louisiana and North Dakota have Spanish as their second most spoken, it’s been said numerous times in the comments under these posts.
[deleted] on
[deleted]
mr_shaboobies on
I’m highly skeptical this map is accurate. I live in the Canadian prairies and the number of French speakers is really quite small other than maybe Manitoba. I’d bet Tagalog or Hindi/Punjabi would be second most popular after English.
traitorgiraffe on
this is fake all of canada would be hindi
Ypres_Love on
I’ve always wondered who these German speakers in the midwest are. Are they very old people who were born in the US to German immigrants in the early 20th century and grew up speaking it at home? I don’t think there were many German immigrants after the first world war.
the_eluder on
So in order to show a shift, you would need to have a couple of maps showing the change over time.
TriangleTadpole on
I’d love to talk with the German speakers in ND.
Quantum_Heresy on
A “shift” denotes a change in one state of affairs to another. What is the “shift” being presented here? From what I can tell this trend — the in-migration and dispersion of native Spanish speakers and the attrition of large non-English-speaking communities (German, Italian, French, &c.) during the same period — has been going on for decades. Usually its helpful to show a ‘before’ and ‘after’ image as a point of comparison when attempting to illustrate a language shift.
Big-Carpenter7921 on
Actual question: Is French spoken more in Nunavut or is it more the indigenous languages?
TemplesOfSyrinx on
Presumably, for BC, “Chinese” means one of Mandarin or Cantonese, I’d assume.
Krypto_98 on
Im pretty sure Punjabi or Hindi is the most spoken 2nd language in Ontario
Primary-Long4416 on
North Dakota Hallo wie geht es euch?
RadarDataL8R on
Id be surprised if Ontario was still French and not Hindi.


22 Comments
As a Louisiana native I hear Spanish spoken everyday in public. I’ve never heard French.
Who TF is speaking French in Louisiana? This map must be from 1937 or something
This type of map has been posted so so so many times and everytime it gets corrected in comments that French isn’t the second most spoken language in Louisiana for years. It’s also Spanish.
its not a shift with language, and those are immigrants who will ultimately assimilate and speak english like everybody here
LoL…. Creole isn’t French
According to the US Census of 2020, the non-English language breakdown of;
ND state is:
Most Common Non-English Languages
1. Spanish 14,612 households (2.01%)
2. German 4,605 households (0.633%)
3. Other Native Languages of North America 2,630 households (0.361%)
LA state is:
Most Common Non-English Languages
1. Spanish 195,221 households (4.51%)
2. French (Incl. Cajun) 62,417 households (1.44%)
3. Vietnamese 22,554 households (0.521%)
NH state is:
Most Common Non-English Languages
1. Spanish 35,239 households (2.66%)
2. French (Incl. Cajun) 15,637 households (1.18%)
3. Portuguese 5,711 households (0.431%)
For HI I couldn’t find data breaking down the top languages:
Most Common Non-English Languages
1. Ilocano, Samoan, Hawaiian, or Other Austronesian Languages 122,558 households (8.99%)
2. Tagalog (Incl. Filipino) 59,329 households (4.35%)
3. Japanese 37,041 households (2.72%)
[deleted]
christian english colonizer language: 😍
christian spanish colonizer language: 🤬
Ooh, I get to decide for Alaska?? I pik Flemish
Louisiana and North Dakota have Spanish as their second most spoken, it’s been said numerous times in the comments under these posts.
[deleted]
I’m highly skeptical this map is accurate. I live in the Canadian prairies and the number of French speakers is really quite small other than maybe Manitoba. I’d bet Tagalog or Hindi/Punjabi would be second most popular after English.
this is fake all of canada would be hindi
I’ve always wondered who these German speakers in the midwest are. Are they very old people who were born in the US to German immigrants in the early 20th century and grew up speaking it at home? I don’t think there were many German immigrants after the first world war.
So in order to show a shift, you would need to have a couple of maps showing the change over time.
I’d love to talk with the German speakers in ND.
A “shift” denotes a change in one state of affairs to another. What is the “shift” being presented here? From what I can tell this trend — the in-migration and dispersion of native Spanish speakers and the attrition of large non-English-speaking communities (German, Italian, French, &c.) during the same period — has been going on for decades. Usually its helpful to show a ‘before’ and ‘after’ image as a point of comparison when attempting to illustrate a language shift.
Actual question: Is French spoken more in Nunavut or is it more the indigenous languages?
Presumably, for BC, “Chinese” means one of Mandarin or Cantonese, I’d assume.
Im pretty sure Punjabi or Hindi is the most spoken 2nd language in Ontario
North Dakota Hallo wie geht es euch?
Id be surprised if Ontario was still French and not Hindi.