
![[OC] Face Locations in the Average Movie](https://www.byteseu.com/wp-content/uploads/2026/02/zhgedudbpvjg1-1152x1536.png "[OC] Face Locations in the Average Movie")
Source: CineFace (my own repo): https://github.com/astaileyyoung/CineFace
All the data and code can be found there. Visualizations were created in Python with Plotly.
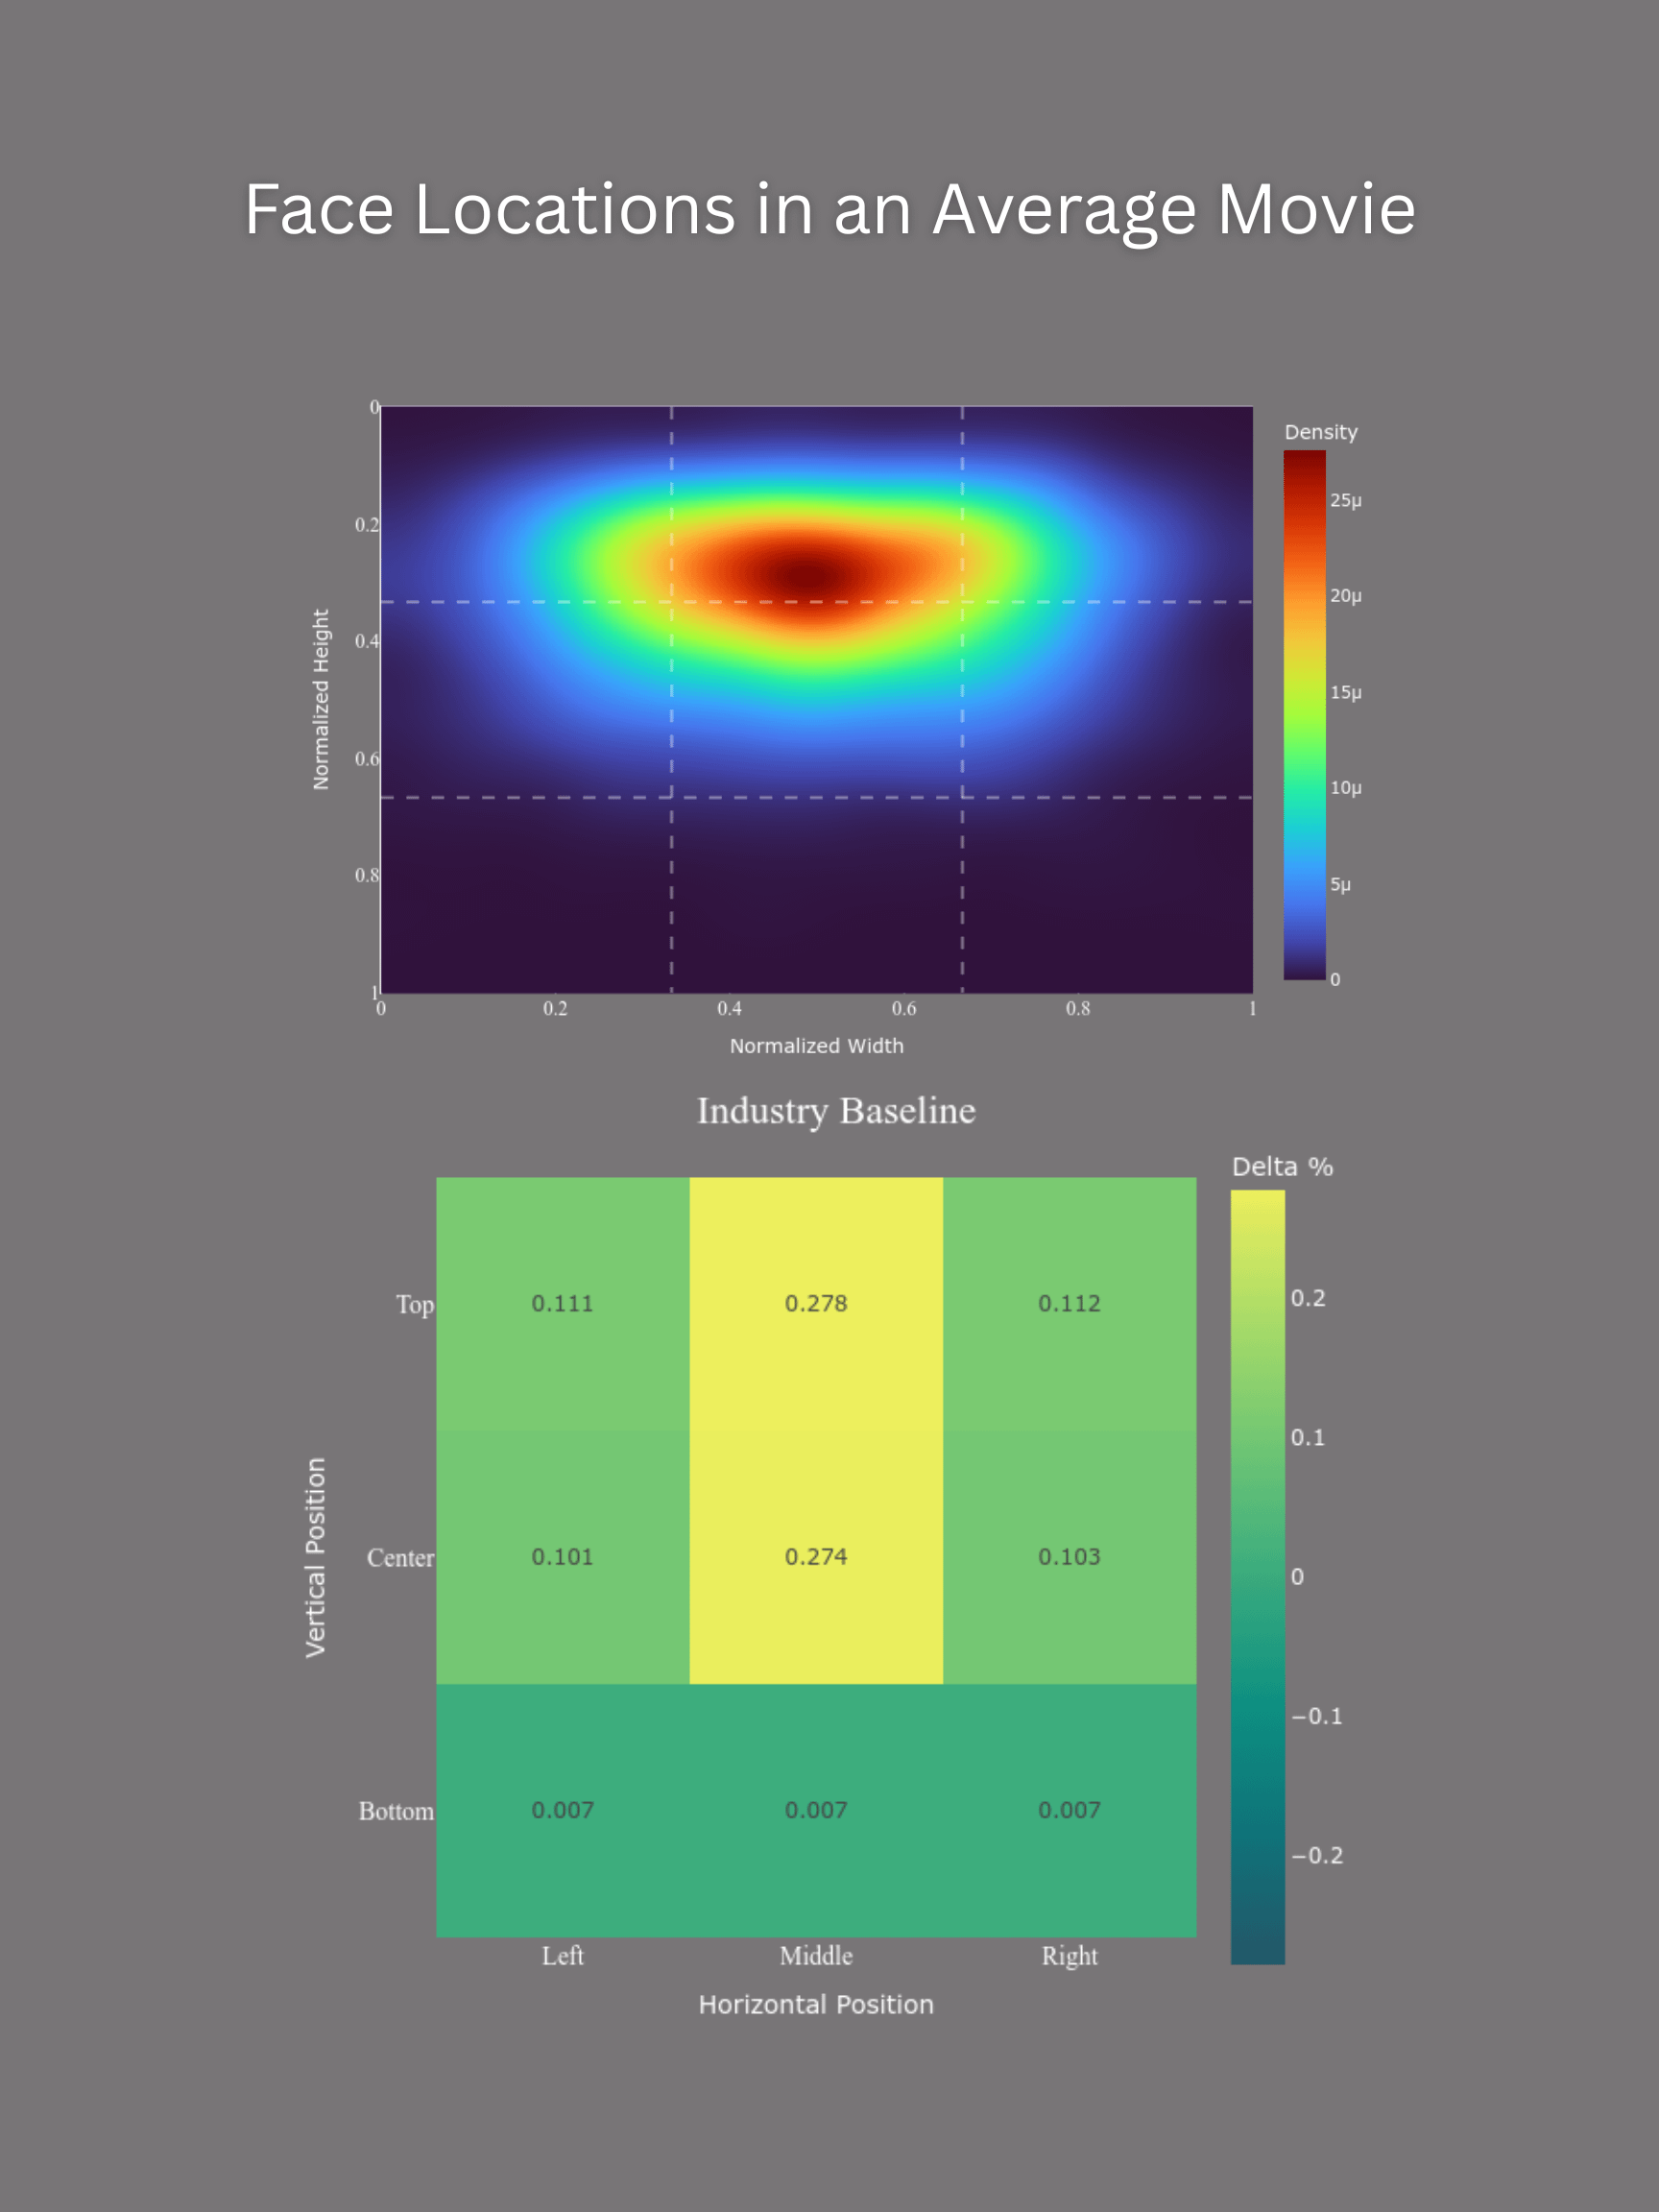
For this project, I ran face detection on over 6,000 movies made between 1900 and 2025. I then took a random sample of 10,000 faces from the ~70 million entries in the database. Because the "rule of thirds" is often discussed in relationship to cinematic framing, I also broke the image into a 3×3 grid and averaged the results from each cell.
Posted by King-Intelligent
18 Comments
It would be better if the graph was in the aspect ratio of the movies too instead of in a random one
So most faces are in the center top third. Would not have guessed it following the rule of thirds. All scenes i ever notice are following that rule. Kind of counterintuitive result
You should try this for non average movies, like battlefield earth
It might have been interesting to see how scenes with only one face differ from scenes with two/three/many.
Fun fact, this is what most home theater sound systems weakest point is voice locating.
To make the sound seem like it’s coming from the actual mouth, the center channel needs to fire from
Either behind the screen, or upwards to fake the location using lapping wavelengths.
One of the reasons SVS center channels actually point slightly up.
I’d love to see how you normalize the different screen formats. Is the bias being more to the left side of the screen due to 4:3 not transferring well to a 16:9 format?
Wow, nice! This opens the door to so much more research, especially into dependencies on decades of production, genre, budget, revenue, oscar nomination, indy nominations, gender age and nationality of director and actors, etc.etc.etc… The options are endless!
Could the face detection algorithm be biased to find faces closer to the middle of the frame?
>Because the “rule of thirds” is often discussed in relationship to cinematic framing, I also broke the image into a 3×3 grid and averaged the results in each cell.
I think you may have misunderstood the rule of thirds.
The idea is that you get more dynamic, engaging compositions by placing subjects on the grid lines or the points of intersection. So which grid square a subject falls into isn’t really relevant; what is relevant is how close the subjects are to the grid lines.
To evaluate this, I think you need a 5×5 grid where the lines are at 2/9ths, 4/9ths, 5/9ths, and 7/9ths. Then any subjects which are between the 2/9 and 4/9 lines, or between the 5/9 and 7/9 lines, are “close” to the lines of a 3×3 grid and are compliant with the rule of thirds.
Very cool data! For a hot second when I was a film student (a couple decades ago at this point) I had dreams and theories about quantifying with Data what makes a film visually interesting. So this is very cool to me!
I wonder if there are any movies where everybody’s in that bottom third the whole time?
I wish to see in different eras. Especially before “avangers” kind of movies.
This is gonna do wonders for the mustache game
Is there a significant different for actors and actresses?
How did the algorithm place people in a moving shot?
Did it detect faces in every frame? If someone walks across a shot, where did it place that face?
Very interesting, thank you.
I have made a version for marvel movies: https://i.imgur.com/828O8v4.png
Any info from shots or frames with no faces or people in them? Like… How often people-less frames appear?
Is there a gender bias in these numners?
I’m curious, how do you define *face* in this visualization? Is it a rectangle encompassing the face, or the triangle formed by eyes and nose?