
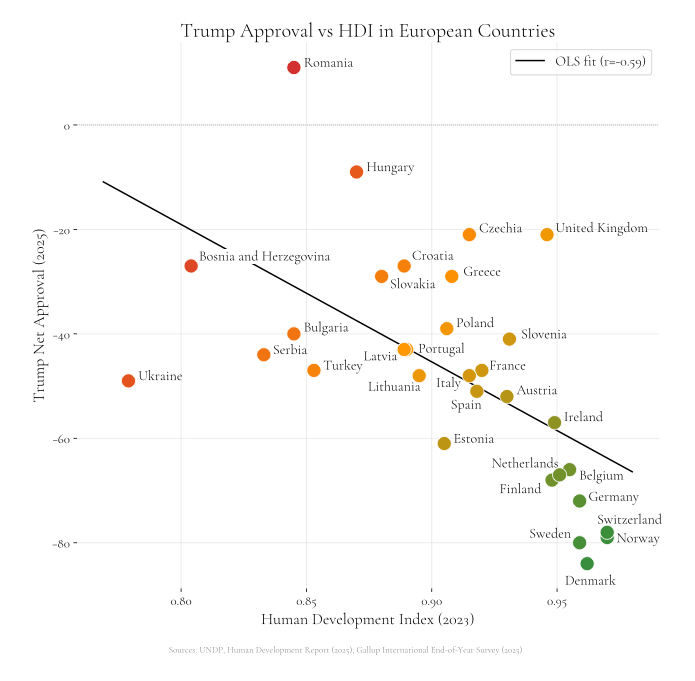
Data sources:
- Human Development Index, 2023 https://ourworldindata.org/grapher/human-development-index
- Gallup International End-of-Year (EOY) Survey https://www.gallup-international.com/survey-results-and-news/survey-result/the-latest-findings-from-the-worlds-longest-running-global-public-opinion-study
Tools used: matplotlib, scipy, pandas, adjustText and some manual adjustments in Sketch.
Posted by huopak
25 Comments
Interesting heteroskedasticity
You should take off Ukraine. They’re only approving of him out of need. Makes the relationship even clearer
Surprisingly Denmark has the lowest Trump approval rate.
Even in Hungary it is below 0!
Also, the fit is deficient. Ukraine should be taken out because it is a warring country, HDI is an outlier there. Then, the fit line would drop down much, much faster with a way better correlation coefficient.
Those countries where people live better despise Trump and his policies. Those countries where people live worse are more prone to being taken by Trump’s populist rhetorics.
Australia would be right there with Norway
Why is the UK rating so “high”?
I think this same relationship applies to US states
Wtf is up with the UK and Czechia?
Weird that the Finland- Netherlands connection is here as well. I would expect Finland to be far more negative.
This chart conveniently glosses over the messy bits like cultural affinities like strongman appeal resonating in places with histories of authoritarian leanings, anti-EU sentiments, or plain old economic resentment toward Western hegemony. It’s selective framing to pat the high-HDI crowd on the back.
Propaganda at its finest: simplistic, divisive, and utterly predictable.
Proud of our little green Danish dot.
It’s a bit odd that you chose green to signify the worst approval. The colors should be opposite.
If Trump… who runs in “American first”… get high approval reading from foreign citizens, I would argue he’s doing a terrible job
Any chance you can redo it and show the zero on the axes?
It’s sad to see the UK be an outlier for the wrong reasons
This graph might also be a hint that countries with a poorly performing economy, where people face more struggles to live a decent life, have a tendency to accept authoritarian regimes or extremist views, possibly to work around the country’s issues. Would that be a correct interpretation?
I wonder how this correlates with countries that have a IDU member party in government.
https://en.wikipedia.org/wiki/International_Democracy_Union
What exactly is -50 approval rating? I dont quite get it. Does that mean 50% approve and 50% disaprove?
I hate the +/- thing because it obscures the facts of how much something (in this case Trump) is liked or not liked.
-60, for example, looks brutal. It’s an 80/20 split. 1 person in 5 supports Trump along the -60 line. That’s still a lot. If you lived in a -60 area, you’d see Trumpists every day, and lots of them. But “-60” makes it seem like nobody likes the guy.
-40 is a 70/30 split. Basically one person in 3 for (in this case) Trump. That is still a proportionally huge number of people.
Ukraine is interesting. At about -50, it means 1 person in 4 is a Trumpist in Ukraine. It’s amazing to me that is so high
To get a +/- where the outcome is “we rarely see these people”, let’s call in 1 person in 30… That’s about -94.
I am saddened by the U.K.
It just shows how much propaganda from Trump’s masters and supporters we are receiving to make Reform more palatable.
Who tf are they asking in the UK? Everyone thinks he’s a moron
i love how you color coded “correct” area
Both axes need to be log-odds transformed before the OLS split. You see the effect of not doing this in the lower right where you can’t have HDI > 1
Would English familiarity level have similar result? (Except UK for some reasons) I found that the country with many people don’t know how to reach to the original source will be an easy target to be manipulated by fake news and influencer on social media.
Correlation does not imply causation