

Feb 25, 2026
IndexBox has just published a new report: Middle East – Turkey Meat – Market Analysis, Forecast, Size, Trends And Insights.
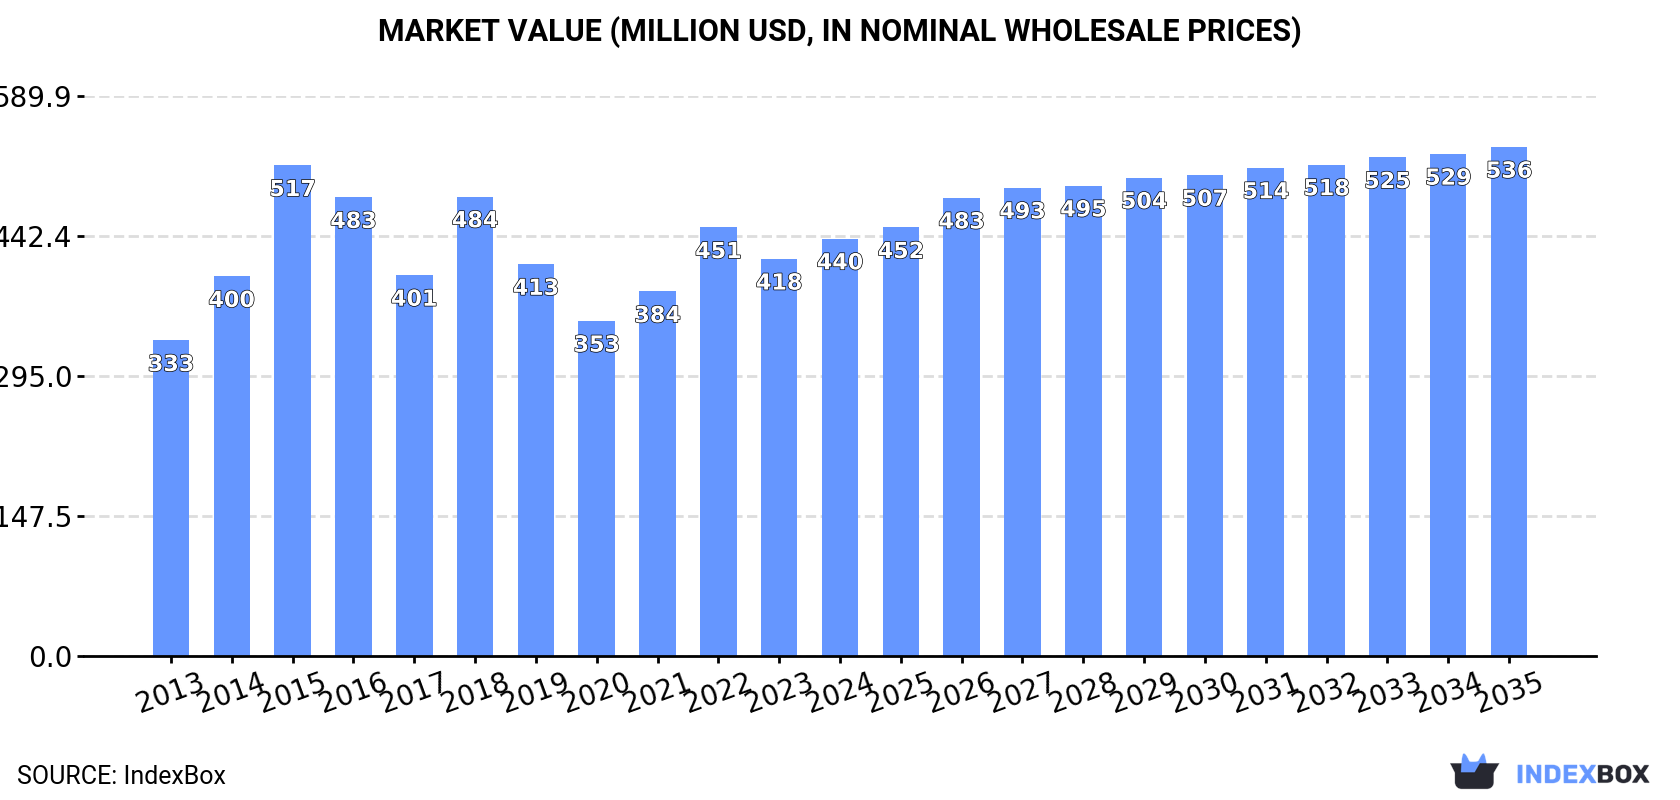
The Middle East turkey meat market, valued at $440M in 2024, is forecast to grow at a CAGR of +1.8% in value terms through 2035, reaching $536M. Consumption is concentrated in Israel, Turkey, and Palestine, which together account for 89% of volume. While regional production is led by Israel and Turkey, imports saw a rebound in 2024, with Palestine as the largest importer. The market is characterized by rising import prices and a shift in export product mix towards more value-added fresh or chilled cuts.
Key Findings
- Middle East turkey meat market value is projected to grow at a CAGR of +1.8%, reaching $536M by 2035
- Israel, Turkey, and Palestine dominate consumption, collectively accounting for 89% of the regional volume
- Palestine is the largest importer by value, while Israel remains the leading exporter and highest-value market
- Import prices have risen significantly, increasing by 68.1% since 2018 to an average of $3,698 per ton in 2024
- Exports are shifting towards higher-value fresh or chilled turkey cuts, which grew at an average annual rate of +4.5%
Market Forecast
Driven by increasing demand for turkey meat in the Middle East, the market is expected to continue an upward consumption trend over the next decade. Market performance is forecast to retain its current trend pattern, expanding with an anticipated CAGR of +1.2% for the period from 2024 to 2035, which is projected to bring the market volume to 177K tons by the end of 2035.
In value terms, the market is forecast to increase with an anticipated CAGR of +1.8% for the period from 2024 to 2035, which is projected to bring the market value to $536M (in nominal wholesale prices) by the end of 2035.
 ConsumptionMiddle East’s Consumption of Turkey Meat
In 2024, consumption of turkey meat increased by 0.8% to 156K tons, rising for the third consecutive year after three years of decline. The total consumption volume increased at an average annual rate of +1.5% over the period from 2013 to 2024; the trend pattern remained consistent, with only minor fluctuations being recorded throughout the analyzed period. As a result, consumption reached the peak volume of 192K tons. From 2016 to 2024, the growth of the consumption remained at a lower figure.
The revenue of the turkey meat market in the Middle East rose rapidly to $440M in 2024, surging by 5.1% against the previous year. This figure reflects the total revenues of producers and importers (excluding logistics costs, retail marketing costs, and retailers’ margins, which will be included in the final consumer price). The market value increased at an average annual rate of +2.6% from 2013 to 2024; the trend pattern indicated some noticeable fluctuations being recorded in certain years. As a result, consumption reached the peak level of $517M. From 2016 to 2024, the growth of the market remained at a somewhat lower figure.
Consumption By Country
The countries with the highest volumes of consumption in 2024 were Israel (85K tons), Turkey (47K tons) and Palestine (6.4K tons), together comprising 89% of total consumption. Iran, Oman and Kuwait lagged somewhat behind, together accounting for a further 7.5%.
From 2013 to 2024, the most notable rate of growth in terms of consumption, amongst the key consuming countries, was attained by Kuwait (with a CAGR of +6.1%), while consumption for the other leaders experienced more modest paces of growth.
In value terms, Israel ($268M) led the market, alone. The second position in the ranking was held by Turkey ($98M). It was followed by Palestine.
From 2013 to 2024, the average annual growth rate of value in Israel stood at +4.7%. The remaining consuming countries recorded the following average annual rates of market growth: Turkey (+3.5% per year) and Palestine (-2.8% per year).
In 2024, the highest levels of turkey meat per capita consumption was registered in Israel (8.7 kg per person), followed by Palestine (1.1 kg per person), Oman (0.6 kg per person) and Turkey (0.5 kg per person), while the world average per capita consumption of turkey meat was estimated at 0.4 kg per person.
In Israel, turkey meat per capita consumption expanded at an average annual rate of +1.9% over the period from 2013-2024. In the other countries, the average annual rates were as follows: Palestine (-8.3% per year) and Oman (-0.5% per year).
ProductionMiddle East’s Production of Turkey Meat
After two years of growth, production of turkey meat decreased by -0.1% to 154K tons in 2024. The total output volume increased at an average annual rate of +2.0% over the period from 2013 to 2024; the trend pattern remained relatively stable, with only minor fluctuations being observed in certain years. The pace of growth was the most pronounced in 2018 when the production volume increased by 24% against the previous year. As a result, production reached the peak volume of 184K tons. From 2019 to 2024, production growth failed to regain momentum. The general positive trend in terms output was largely conditioned by temperate growth of the number of producing animals and a mild expansion in yield figures.
In value terms, turkey meat production reached $428M in 2024 estimated in export price. The total output value increased at an average annual rate of +3.0% from 2013 to 2024; the trend pattern indicated some noticeable fluctuations being recorded throughout the analyzed period. The most prominent rate of growth was recorded in 2018 with an increase of 28% against the previous year. As a result, production attained the peak level of $477M. From 2019 to 2024, production growth remained at a somewhat lower figure.
Production By Country
The countries with the highest volumes of production in 2024 were Israel (91K tons), Turkey (51K tons) and Iran (6K tons), together accounting for 96% of total production. These countries were followed by Oman, which accounted for a further 2.1%.
From 2013 to 2024, the most notable rate of growth in terms of production, amongst the main producing countries, was attained by Oman (with a CAGR of +3.2%), while production for the other leaders experienced more modest paces of growth.
Yield
The average turkey meat yield fell to 7.6 kg per head in 2024, with a decrease of -5.7% compared with 2023. The yield figure increased at an average annual rate of +1.7% over the period from 2013 to 2024; the trend pattern remained consistent, with only minor fluctuations throughout the analyzed period. The pace of growth appeared the most rapid in 2018 with an increase of 18% against the previous year. The level of yield peaked at 8.5 kg per head in 2019; however, from 2020 to 2024, the yield remained at a lower figure.
Producing Animals
In 2024, approx. 20M heads of animals slaughtered for turkey meat production in the Middle East; picking up by 6% compared with the previous year. Overall, the number of producing animals continues to indicate a relatively flat trend pattern. The most prominent rate of growth was recorded in 2014 when the number of producing animals increased by 8.6%. Over the period under review, this number reached the peak level at 23M heads in 2015; however, from 2016 to 2024, producing animals failed to regain momentum.
ImportsMiddle East’s Imports of Turkey Meat
In 2024, after three years of decline, there was significant growth in purchases abroad of turkey meat, when their volume increased by 13% to 17K tons. In general, imports, however, recorded a abrupt downturn. The most prominent rate of growth was recorded in 2015 with an increase of 64% against the previous year. As a result, imports reached the peak of 44K tons. From 2016 to 2024, the growth of imports remained at a lower figure.
In value terms, turkey meat imports soared to $64M in 2024. Over the period under review, imports, however, saw a pronounced curtailment. The pace of growth was the most pronounced in 2015 with an increase of 56% against the previous year. As a result, imports reached the peak of $103M. From 2016 to 2024, the growth of imports remained at a somewhat lower figure.
Imports By Country
Palestine was the main importing country with an import of about 6.4K tons, which amounted to 37% of total imports. It was distantly followed by the United Arab Emirates (3.2K tons), Kuwait (2.4K tons), Saudi Arabia (1.4K tons), Jordan (1.4K tons) and Turkey (0.8K tons), together committing a 53% share of total imports. Iraq (670 tons) followed a long way behind the leaders.
From 2013 to 2024, the biggest increases were recorded for Kuwait (with a CAGR of +5.3%), while purchases for the other leaders experienced a decline in the imports figures.
In value terms, Palestine ($26M) constitutes the largest market for imported turkey meat in the Middle East, comprising 41% of total imports. The second position in the ranking was taken by Kuwait ($12M), with an 18% share of total imports. It was followed by the United Arab Emirates, with a 14% share.
In Palestine, turkey meat imports decreased by an average annual rate of -1.8% over the period from 2013-2024. In the other countries, the average annual rates were as follows: Kuwait (+3.3% per year) and the United Arab Emirates (-0.9% per year).
Imports By Type
In 2024, frozen turkey cuts (11K tons) represented the largest type of turkey meat, comprising 84% of total imports. It was distantly followed by frozen whole turkeys (1.4K tons), creating an 11% share of total imports. Fresh or chilled turkey cuts (545 tons) followed a long way behind the leaders.
Imports of frozen turkey cuts decreased at an average annual rate of -9.2% from 2013 to 2024. fresh or chilled turkey cuts (-8.7%) and frozen whole turkeys (-9.6%) illustrated a downward trend over the same period. The shares of the largest types remained relatively stable throughout the analyzed period.
In value terms, frozen turkey cuts ($35M) constitutes the largest type of turkey meat imported in the Middle East, comprising 83% of total imports. The second position in the ranking was held by frozen whole turkeys ($4.1M), with a 9.6% share of total imports. It was followed by fresh or chilled turkey cuts, with a 6.3% share.
From 2013 to 2024, the average annual rate of growth in terms of the value of frozen turkey cuts imports amounted to -6.2%. With regard to the other imported products, the following average annual rates of growth were recorded: frozen whole turkeys (-8.6% per year) and fresh or chilled turkey cuts (-8.5% per year).
Import Prices By Type
In 2024, the import price in the Middle East amounted to $3,698 per ton, surging by 3.4% against the previous year. Import price indicated a pronounced increase from 2013 to 2024: its price increased at an average annual rate of +3.8% over the last eleven years. The trend pattern, however, indicated some noticeable fluctuations being recorded throughout the analyzed period. Based on 2024 figures, turkey meat import price increased by +68.1% against 2018 indices. The growth pace was the most rapid in 2021 when the import price increased by 20%. The level of import peaked in 2024 and is likely to see steady growth in years to come.
Prices varied noticeably by the product type; the product with the highest price was fresh or chilled turkey cuts ($4,911 per ton), while the price for frozen whole turkeys ($3,020 per ton) was amongst the lowest.
From 2013 to 2024, the most notable rate of growth in terms of prices was attained by frozen turkey cut (+3.4%), while the other products experienced more modest paces of growth.
Import Prices By Country
The import price in the Middle East stood at $3,698 per ton in 2024, with an increase of 3.4% against the previous year. Import price indicated tangible growth from 2013 to 2024: its price increased at an average annual rate of +3.8% over the last eleven-year period. The trend pattern, however, indicated some noticeable fluctuations being recorded throughout the analyzed period. Based on 2024 figures, turkey meat import price increased by +68.1% against 2018 indices. The pace of growth appeared the most rapid in 2021 when the import price increased by 20% against the previous year. Over the period under review, import prices reached the maximum in 2024 and is likely to see steady growth in the immediate term.
There were significant differences in the average prices amongst the major importing countries. In 2024, amid the top importers, the country with the highest price was Kuwait ($4,826 per ton), while Iraq ($1,569 per ton) was amongst the lowest.
From 2013 to 2024, the most notable rate of growth in terms of prices was attained by Jordan (+9.2%), while the other leaders experienced more modest paces of growth.
ExportsMiddle East’s Exports of Turkey Meat
In 2024, shipments abroad of turkey meat was finally on the rise to reach 15K tons for the first time since 2019, thus ending a four-year declining trend. In general, exports, however, saw a perceptible reduction. The most prominent rate of growth was recorded in 2019 when exports increased by 37% against the previous year. Over the period under review, the exports hit record highs at 25K tons in 2013; however, from 2014 to 2024, the exports remained at a lower figure.
In value terms, turkey meat exports fell to $39M in 2024. Overall, exports, however, recorded a noticeable curtailment. The most prominent rate of growth was recorded in 2019 with an increase of 39% against the previous year. The level of export peaked at $66M in 2013; however, from 2014 to 2024, the exports stood at a somewhat lower figure.
Exports By Country
In 2024, Israel (6K tons) and Turkey (4.5K tons) were the main exporters of turkey meat in the Middle East, together generating 70% of total exports. Saudi Arabia (2.6K tons) took a 17% share (based on physical terms) of total exports, which put it in second place, followed by the United Arab Emirates (6.1%). Lebanon (617 tons) followed a long way behind the leaders.
From 2013 to 2024, the most notable rate of growth in terms of shipments, amongst the leading exporting countries, was attained by Lebanon (with a CAGR of +20.5%), while the other leaders experienced more modest paces of growth.
In value terms, Israel ($23M) remains the largest turkey meat supplier in the Middle East, comprising 59% of total exports. The second position in the ranking was taken by Turkey ($11M), with a 28% share of total exports. It was followed by the United Arab Emirates, with a 4.9% share.
From 2013 to 2024, the average annual rate of growth in terms of value in Israel amounted to -6.2%. In the other countries, the average annual rates were as follows: Turkey (-1.8% per year) and the United Arab Emirates (-4.2% per year).
Exports By Type
In 2024, frozen turkey cuts (11K tons) was the main type of turkey meat, generating 83% of total exports. Fresh or chilled turkey cuts (1.4K tons) ranks second in terms of the total exports with an 11% share, followed by frozen whole turkeys (5.1%). Fresh or chilled whole turkeys (223 tons) took a relatively small share of total exports.
From 2013 to 2024, average annual rates of growth with regard to frozen turkey cuts exports of stood at -7.0%. At the same time, fresh or chilled turkey cuts (+4.5%) displayed positive paces of growth. Moreover, fresh or chilled turkey cuts emerged as the fastest-growing type exported in the Middle East, with a CAGR of +4.5% from 2013-2024. Fresh or chilled whole turkeys experienced a relatively flat trend pattern. By contrast, frozen whole turkeys (-1.9%) illustrated a downward trend over the same period. Fresh or chilled turkey cuts (+7.3 p.p.) and frozen whole turkeys (+1.9 p.p.) significantly strengthened its position in terms of the total exports, while frozen turkey cuts saw its share reduced by -10.1% from 2013 to 2024, respectively. The shares of the other products remained relatively stable throughout the analyzed period.
In value terms, frozen turkey cuts ($31M) remains the largest type of turkey meat supplied in the Middle East, comprising 78% of total exports. The second position in the ranking was held by fresh or chilled turkey cuts ($5.5M), with a 14% share of total exports. It was followed by frozen whole turkeys, with a 6.2% share.
From 2013 to 2024, the average annual rate of growth in terms of the value of frozen turkey cuts exports stood at -5.9%. For the other products, the average annual rates were as follows: fresh or chilled turkey cuts (+5.1% per year) and frozen whole turkeys (-0.4% per year).
Export Prices By Type
The export price in the Middle East stood at $2,586 per ton in 2024, with a decrease of -16.5% against the previous year. Overall, the export price continues to indicate a relatively flat trend pattern. The most prominent rate of growth was recorded in 2022 when the export price increased by 19% against the previous year. The level of export peaked at $3,097 per ton in 2023, and then declined notably in the following year.
Average prices varied somewhat amongst the major exported products. In 2024, major exported products recorded the following prices: in fresh or chilled turkey cuts ($4,052 per ton) and fresh or chilled whole turkeys ($3,948 per ton), while the average price for exports of frozen turkey cuts ($2,927 per ton) and frozen whole turkeys ($3,768 per ton) were amongst the lowest.
From 2013 to 2024, the most notable rate of growth in terms of prices was attained by frozen whole turkey (+1.6%), while the other products experienced more modest paces of growth.
Export Prices By Country
In 2024, the export price in the Middle East amounted to $2,586 per ton, declining by -16.5% against the previous year. Over the period under review, the export price recorded a relatively flat trend pattern. The pace of growth was the most pronounced in 2022 when the export price increased by 19% against the previous year. The level of export peaked at $3,097 per ton in 2023, and then contracted rapidly in the following year.
There were significant differences in the average prices amongst the major exporting countries. In 2024, amid the top suppliers, the country with the highest price was Israel ($3,778 per ton), while Saudi Arabia ($663 per ton) was amongst the lowest.
From 2013 to 2024, the most notable rate of growth in terms of prices was attained by Israel (+2.8%), while the other leaders experienced mixed trends in the export price figures.
This report provides a comprehensive view of the turkey meat industry in Middle East, tracking demand, supply, and trade flows across the regional value chain. It explains how demand across key channels and end-use segments shapes consumption patterns, while also mapping the role of input availability, production efficiency, and regulatory standards on supply.
Beyond headline metrics, the study benchmarks prices, margins, and trade routes so you can see where value is created and how it moves between exporters and importers within Middle East. The analysis is designed to support strategic planning, market entry, portfolio prioritization, and risk management in the turkey meat landscape in Middle East.
Quick navigation
Key findings
- Regional demand is shaped by both household and industrial usage, with trade flows linking supply hubs to import-reliant countries.
- Pricing dynamics reflect unit values, freight costs, exchange rates, and regulatory shifts that affect sourcing decisions.
- Supply depends on input availability and production efficiency, creating distinct cost curves across Middle East.
- Market concentration varies by country, creating different competitive landscapes and entry barriers.
- The 2035 outlook highlights where capacity investment and demand growth are most aligned within the region.
Report scope
The report combines market sizing with trade intelligence and price analytics for Middle East. It covers both historical performance and the forward outlook to 2035, allowing you to compare cycles, structural shifts, and policy impacts across countries and sub-regions.
- Market size and growth in value and volume terms
- Consumption structure by end-use segments and countries
- Production capacity, output, and cost dynamics
- Regional trade flows, exporters, importers, and balances
- Price benchmarks, unit values, and margin signals
- Competitive context and market entry conditions
Product coverageCountry coverageCountry profiles and benchmarks
For the regional report, country profiles provide a consistent view of market size, trade balance, prices, and per-capita indicators across Middle East. The profiles highlight the largest consuming and producing markets and allow direct benchmarking across peers.
Methodology
The analysis is built on a multi-source framework that combines official statistics, trade records, company disclosures, and expert validation. Data are standardized, reconciled, and cross-checked to ensure consistency across time series.
- International trade data (exports, imports, and mirror statistics)
- National production and consumption statistics
- Company-level information from financial filings and public releases
- Price series and unit value benchmarks
- Analyst review, outlier checks, and time-series validation
All data are normalized to a common product definition and mapped to a consistent set of codes. This ensures that comparisons across time are aligned and actionable.
Forecasts to 2035
The forecast horizon extends to 2035 and is based on a structured model that links turkey meat demand and supply to macroeconomic indicators, trade patterns, and sector-specific drivers. The model captures both cyclical and structural factors and reflects known policy and technology shifts within Middle East.
- Historical baseline: 2012-2025
- Forecast horizon: 2026-2035
- Scenario-based sensitivity to income growth, substitution, and regulation
- Capacity and investment outlook for major producing countries
Each country projection is built from its own historical pattern and the regional context, allowing the report to show where growth is concentrated and where risks are elevated.
Price analysis and trade dynamics
Prices are analyzed in detail, including export and import unit values, regional spreads, and changes in trade costs. The report highlights how seasonality, freight rates, exchange rates, and supply disruptions influence pricing and margins.
- Price benchmarks by country and sub-region
- Export and import unit value trends
- Seasonality and calendar effects in trade flows
- Price outlook to 2035 under baseline assumptions
Profiles of market participants
Key producers, exporters, and distributors are profiled with a focus on their operational scale, geographic footprint, product mix, and market positioning. This helps identify competitive pressure points, partnership opportunities, and routes to differentiation.
- Business focus and production capabilities
- Geographic reach and distribution networks
- Cost structure and pricing strategy indicators
- Compliance, certification, and sustainability context
How to use this report
- Quantify regional demand and identify the most attractive country markets
- Evaluate export opportunities and prioritize target destinations
- Track price dynamics and protect margins
- Benchmark performance against regional competitors
- Build evidence-based forecasts for investment decisions
This report is designed for manufacturers, distributors, importers, wholesalers, investors, and advisors who need a clear, data-driven picture of turkey meat dynamics in Middle East.
FAQ
What is included in the turkey meat market in Middle East?
The market size aggregates consumption and trade data at country and sub-regional levels, presented in both value and volume terms.
How are the forecasts to 2035 built?
The projections combine historical trends with macroeconomic indicators, trade dynamics, and sector-specific drivers.
Does the report cover prices and margins?
Yes, it includes export and import unit values, regional spreads, and a pricing outlook to 2035.
Which countries are profiled in detail?
The report provides profiles for the largest consuming and producing countries in Middle East.
Can this report support market entry decisions?
Yes, it highlights demand hotspots, trade routes, pricing trends, and competitive context.