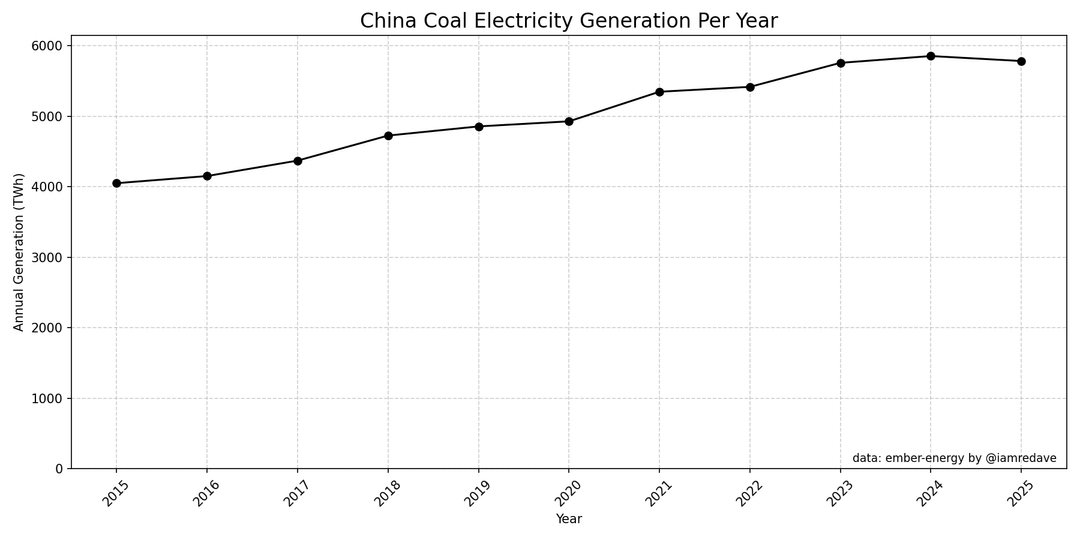
I made a bet with a redditor that China would reduce coal usage for electricity this year. And it looks like it has. Coal is alos used in steel and some chemicals manufacture and so total usage is still probably up.
Pin_ny on
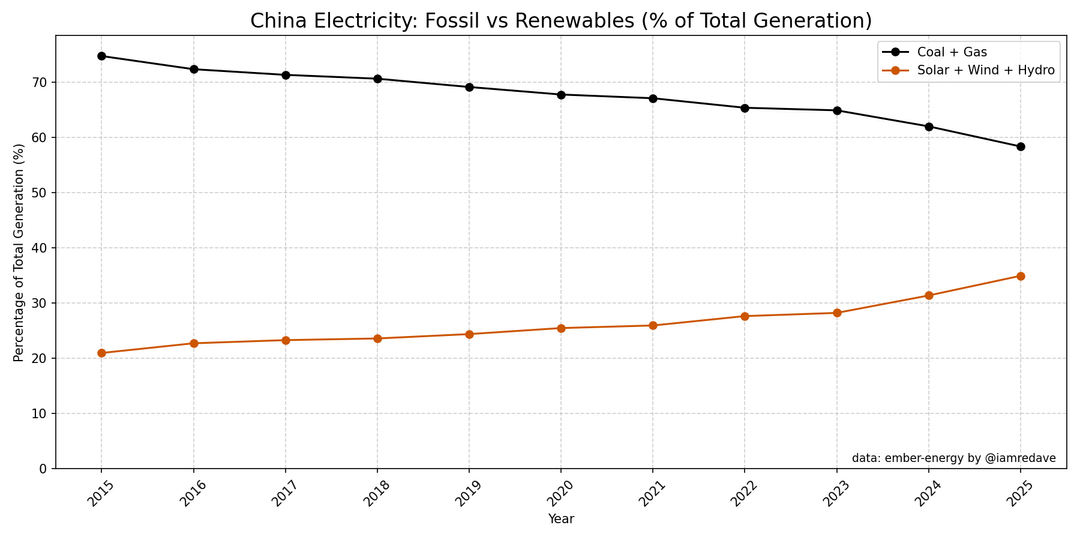
“reduced coal” **consumption relatively to solar energy**
SomeSchmidt on
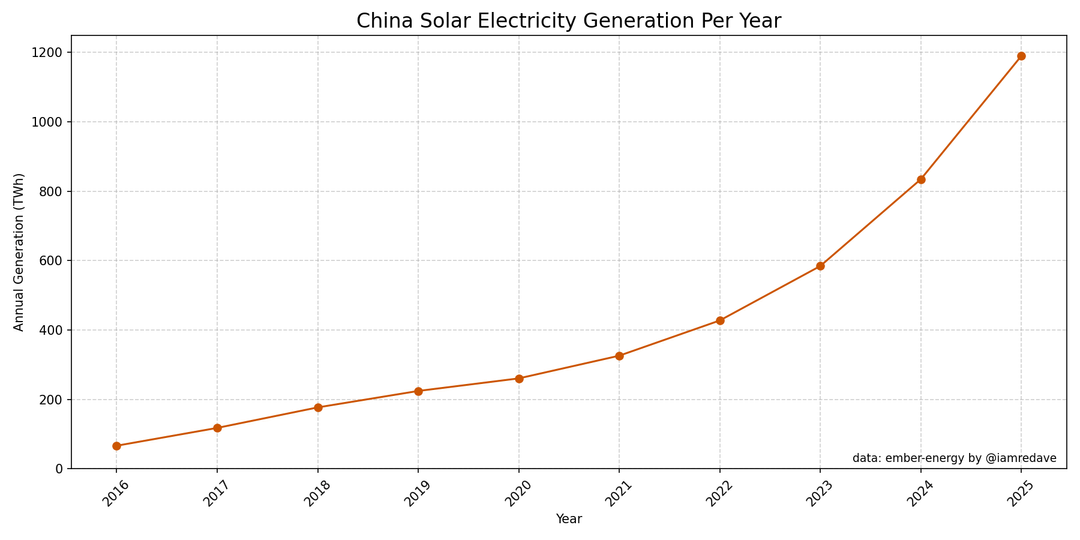
Still a ways to go but the trend of that “Solar Electricity Generation / Year” graph is awesome.

![China reduced Coal and increased Solar for electricity in 2025 [OC]](https://www.byteseu.com/wp-content/uploads/2026/02/we8hk4ucpnlg1-1024x512.png "China reduced Coal and increased Solar for electricity in 2025 [OC]")
4 Comments
Year Coal_TWh
2023 5755
2024 5851
2025 5781
Data from [Ember Energy ](https://ember-energy.org/data/electricity-data-explorer/?fuel=fossil&entity=China)
Python matplotlib code used to create the graphs
I made a bet with a redditor that China would reduce coal usage for electricity this year. And it looks like it has. Coal is alos used in steel and some chemicals manufacture and so total usage is still probably up.
“reduced coal” **consumption relatively to solar energy**
Still a ways to go but the trend of that “Solar Electricity Generation / Year” graph is awesome.
Where is nuclear in the total generation graph?