Is this normalized for Single Family Homes vs condos?
…eg, the proportion of buys for each may vary over time.
StanknBeans on
Am Canadian. Must be lucky because the 1990’s 3.5x is pretty bang on for me.
szhod on
US is fourth last but always whining the most.
Looking-for-42 on
If only I were able to spend my complete salary only for my house…
Evil_Merlin on
The US looks moderate? It’s the 4th from the bottom. Which means there are 16 nations rated worse, and 3 better…
noonearya on
No way Portugal is correct.. it’s much much more
KnotSoSalty on
Why aren’t India and China on this list?
BuvantduPotatoSpirit on
Bad news for people who save up 100% of the purchase price before buying a house.
JustAMarriedGuy on
I’m a boomer and I bought my house for $10
poloc-h on
with aging population is western Europe en route for a Japanese scenario
flame_work on
Wait for a few decades. Due to fertility rate i’ll be easier, like Jpn 🙁
ketosoy on
Isnt this seriously confounded by “do the poorer residents buy or rent”
Moist_Farmer3548 on
Would be better if it was ordered by multiple in 2024. I’m not sure what you have used for ordering it, but it makes comparison a little more difficult.
Dracogame on
Italy is deceptive. Cities where people actually want to live the prices skyrocketed. But there’s a lot of small towns in the middle of nowhere where prices went down.
PuffyPanda200 on
If Shanghai was on this it would be at around 37, more than double the hong Kong number.
Chinese house prices are crazy.
Additional_Luck_1508 on
I misread this as “years of slavery”
Candid_Cat_5921 on
Japan’s drop makes sense because their population is plummeting, especially the younger generations. So there a lot less demand than supply now.
With the falling birthrates and reduced immigration in the US, I wouldn’t be surprised if we start seeing a big drop over the next 5 years here too. The signs are already slightly visible as you look at the number of homes up for sale compared to those that sell. Sellers and agents just aren’t willing to accept the reality, so instead of dropping the prices majorly, they just let the houses sit on the market for months and months before pulling them.
Difficult-Cricket541 on
so its not just the US. its most of the developed world. only place that is the opposite is China. The government built so many apartments they had to blow them up. No one would buy it. the thought is that it was corruption and creating jobs. However, if you look at chinese apartments they are small, cheaply made, and ugly. virtually no one has an actual single family home. too many people. most people in cities live in 50 story towers in tiny and ugly apartments.
sithelephant on
You can’t quite do this and have a very valid graph that means what it appears to on the title.
Not subtracting off from income (I assume that it’s post-tax income) unavoidable costs for 99% of people, such as food, heating, … makes today look more affordable than it is.
diago1408 on
How is “home” defined? Single family detached home? Condo? Townhome? This matters a lot for dense urban populations.
Deustria on
Must be the immigrants fault s/
Ppanter on
Germany much better off than I would have expected… as a German haha
urattentionworthmore on
Damn near impossible to conflate all the the housing economies represented across the U.S.
tsardonicpseudonomi on
Hong Kong is a city. Why is it in here with countries? You’re comparing tadpoles to lemonade.
Cbsandifer on
Living in the US. Good perspective but simplified not taking into account geography given the US size.
Interesting to see if it scales the same Rome vs NYC and Sydney vs LA. Then maybe a “mid-market” like Charlotte or Dallas vs whatever those may be in the top handful.
MoralMiscreant on
How is Singapore so cheap? When I lived there a decade ago, my rent was $3k for a 2 br apartment.
I guess it could be the whole 99 year lease instead of permanent ovmwnership, I guess
Spiritak on
The worst onea are not even there. I am from Czechia and we are the worst together with Slovakia in whole EU. Its like 14-15 years if you check the data.
So Its kind of funny you Havel Italy, Denmark or Spain from EU with 6 years and then us with 13+ years.
thecraftybee1981 on
I do not think the figures for the UK have not been calculated properly. The median property in England for 2024 was £295k – it would have been less for the UK as a whole, but use that as a basis.
The median “disposable” household income for the UK is £36700. Using that figure you would have a ratio of x8.0 which is close enough to the figure presented here, but is markedly different to how it’s described – median household income.
The median full-time worker (30+hours per week) earned £37400 in 2024. That would give a ratio of 7.9.
The median average worker (full timers plus part timers) would have earned around £33700 in 2024, and that comes out as a ratio of 8.8 shown here.
That makes me think that this graph shows the ratio of median property prices to an **individual worker’s income**, not a household’s income, which would be higher.
Is it the same for other countries?
Sir-Viette on
The data is wrong. In Australia it’s 14.1x, not 8.8x
Source: The Australian Bureau of Statistics and their [Data By Region page](https://dbr.abs.gov.au/region.html?lyr=aus&rgn=AUS). In 2024, the median price of a house was $780,000. The median income was $55,000. That’s 14.1 times.
Id like to see that with some sort of taxation adjustment.
Im Canadian, and I’d take HK ratios if it comes with the same tax rate
Kohlbehr on
But the US is so terrible people are leaving in droves? 🤣 where are they going? 🤣
previousinnovation on
To my understanding the housing situation in Japan is pretty unique. Houses are financial liabilities that lose value over time, and they only last 20-30 years before being demolished.

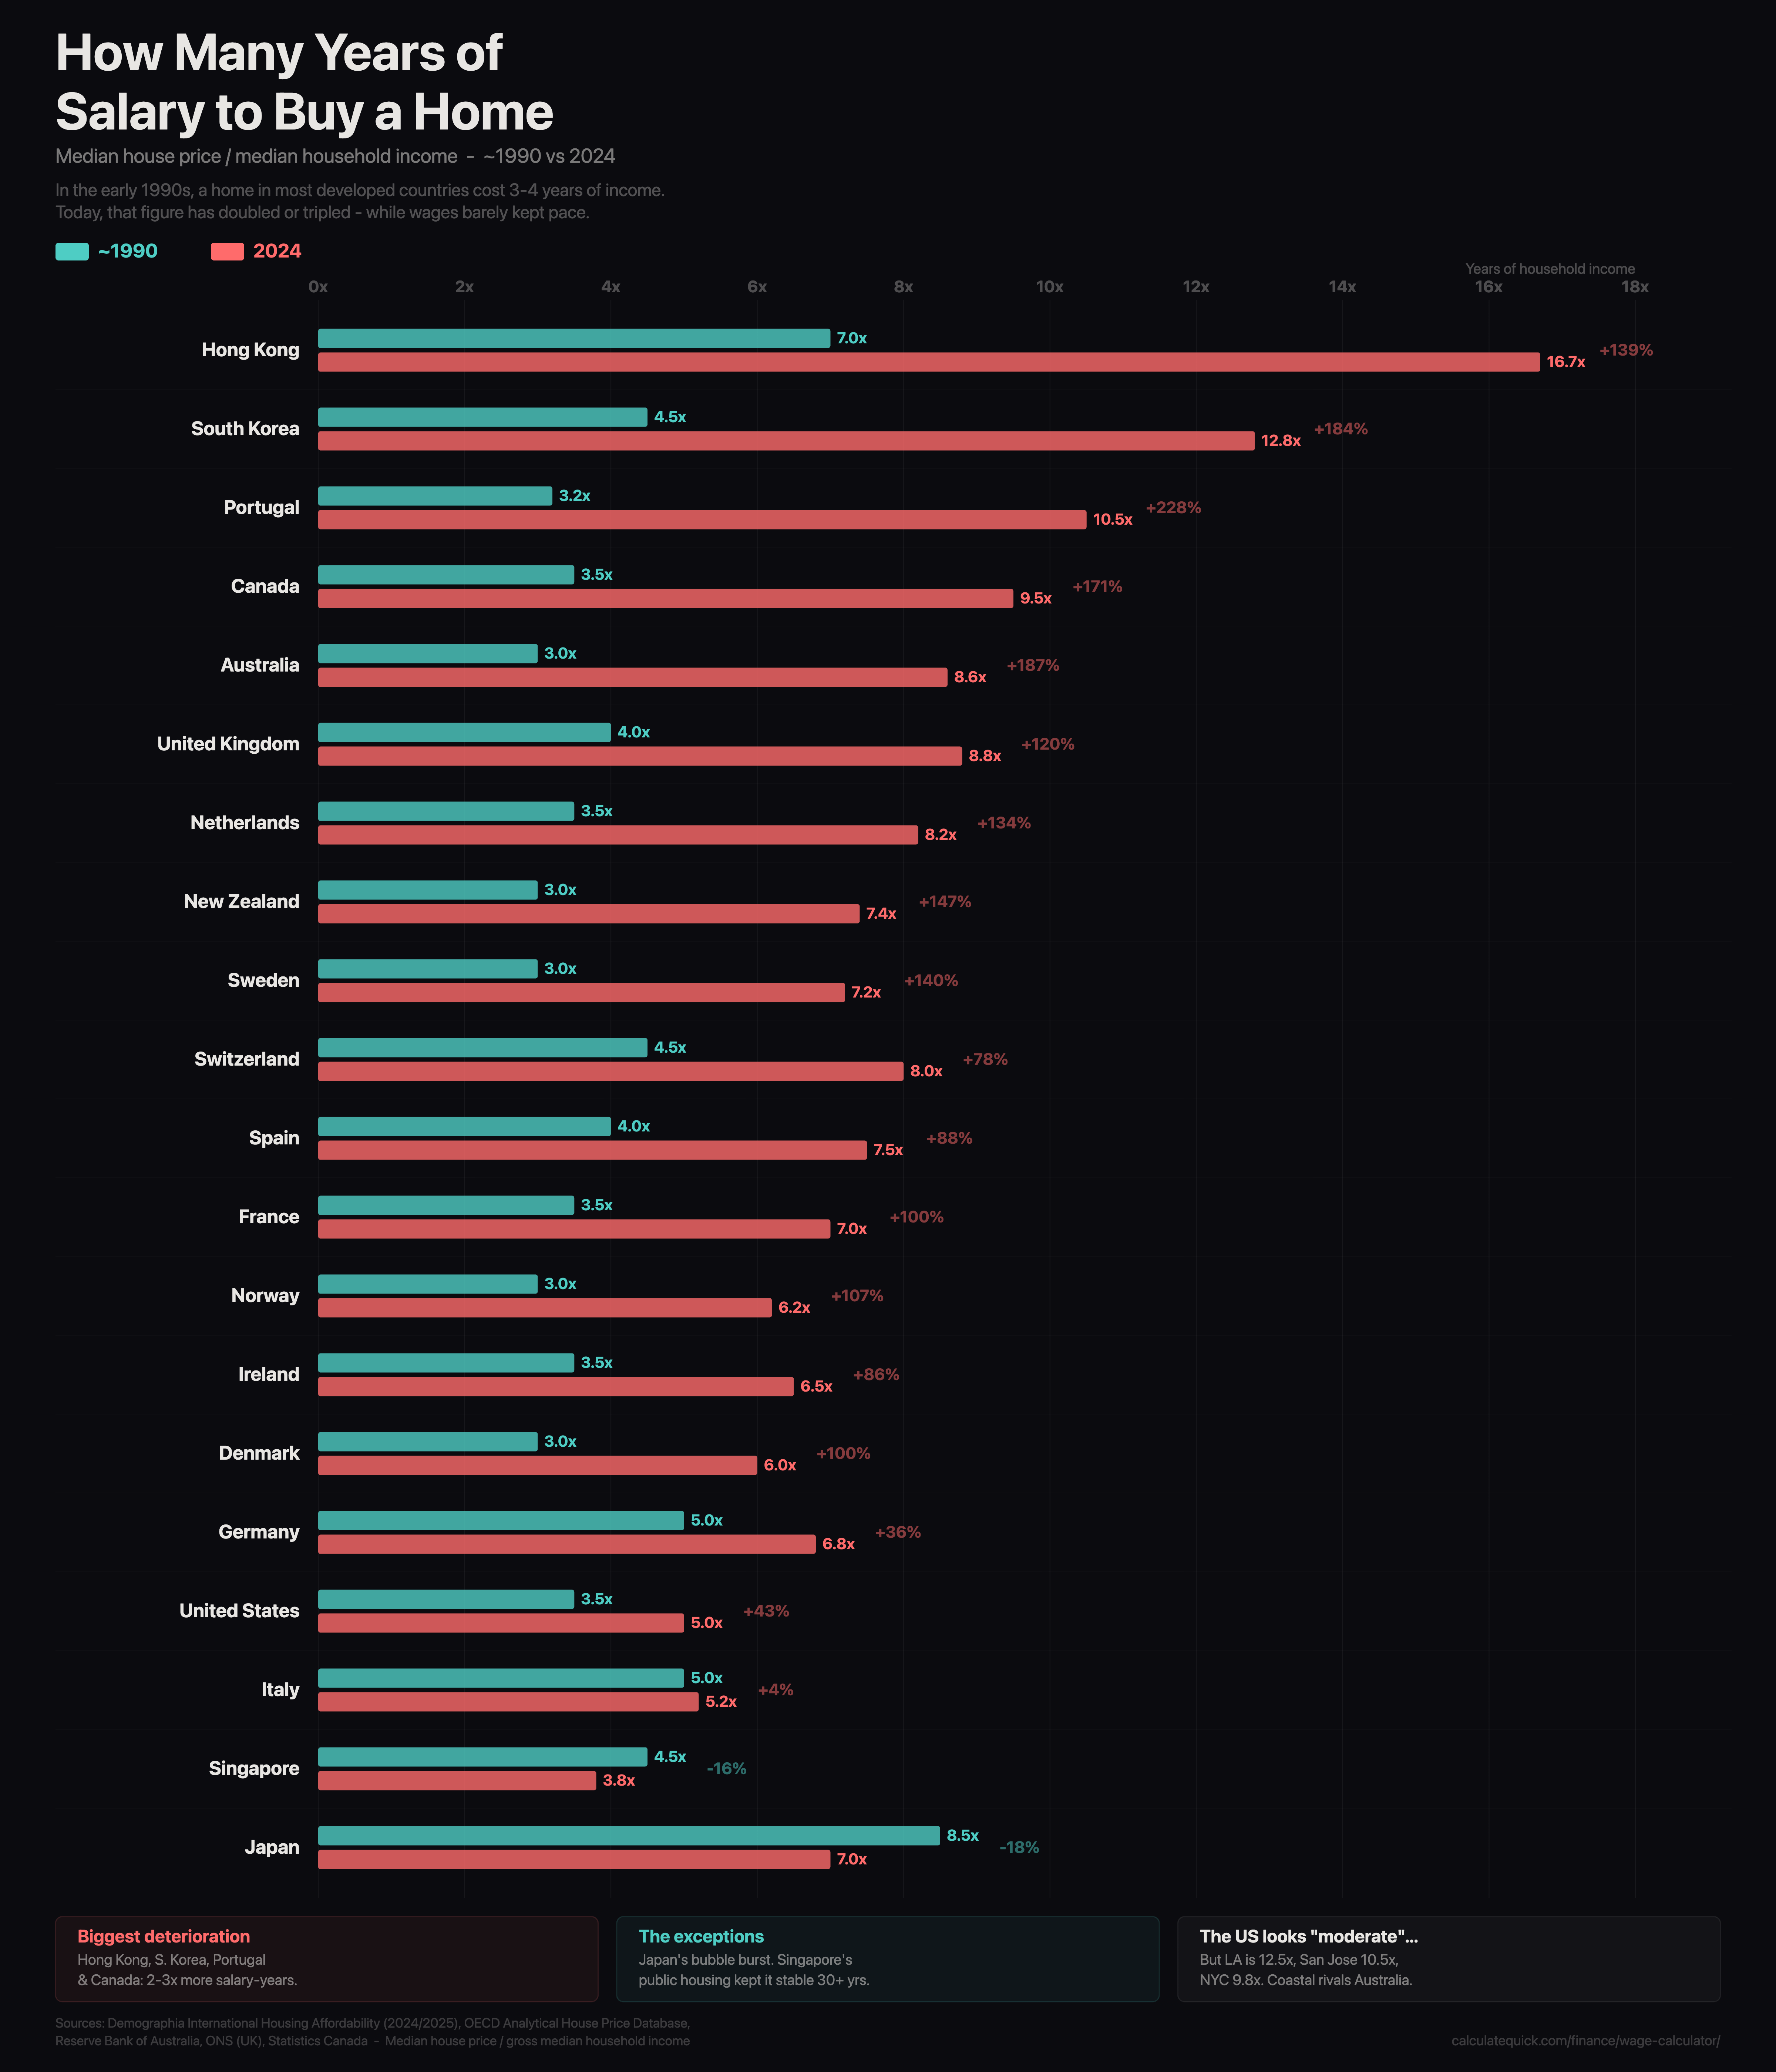
![[OC] How Many Years of Salary It Takes to Buy a Home - 1990 vs 2024](https://www.byteseu.com/wp-content/uploads/2026/02/zrua7j78qwlg1-1317x1536.png "[OC] How Many Years of Salary It Takes to Buy a Home – 1990 vs 2024")
32 Comments
Is this normalized for Single Family Homes vs condos?
…eg, the proportion of buys for each may vary over time.
Am Canadian. Must be lucky because the 1990’s 3.5x is pretty bang on for me.
US is fourth last but always whining the most.
If only I were able to spend my complete salary only for my house…
The US looks moderate? It’s the 4th from the bottom. Which means there are 16 nations rated worse, and 3 better…
No way Portugal is correct.. it’s much much more
Why aren’t India and China on this list?
Bad news for people who save up 100% of the purchase price before buying a house.
I’m a boomer and I bought my house for $10
with aging population is western Europe en route for a Japanese scenario
Wait for a few decades. Due to fertility rate i’ll be easier, like Jpn 🙁
Isnt this seriously confounded by “do the poorer residents buy or rent”
Would be better if it was ordered by multiple in 2024. I’m not sure what you have used for ordering it, but it makes comparison a little more difficult.
Italy is deceptive. Cities where people actually want to live the prices skyrocketed. But there’s a lot of small towns in the middle of nowhere where prices went down.
If Shanghai was on this it would be at around 37, more than double the hong Kong number.
Chinese house prices are crazy.
I misread this as “years of slavery”
Japan’s drop makes sense because their population is plummeting, especially the younger generations. So there a lot less demand than supply now.
With the falling birthrates and reduced immigration in the US, I wouldn’t be surprised if we start seeing a big drop over the next 5 years here too. The signs are already slightly visible as you look at the number of homes up for sale compared to those that sell. Sellers and agents just aren’t willing to accept the reality, so instead of dropping the prices majorly, they just let the houses sit on the market for months and months before pulling them.
so its not just the US. its most of the developed world. only place that is the opposite is China. The government built so many apartments they had to blow them up. No one would buy it. the thought is that it was corruption and creating jobs. However, if you look at chinese apartments they are small, cheaply made, and ugly. virtually no one has an actual single family home. too many people. most people in cities live in 50 story towers in tiny and ugly apartments.
You can’t quite do this and have a very valid graph that means what it appears to on the title.
Not subtracting off from income (I assume that it’s post-tax income) unavoidable costs for 99% of people, such as food, heating, … makes today look more affordable than it is.
How is “home” defined? Single family detached home? Condo? Townhome? This matters a lot for dense urban populations.
Must be the immigrants fault s/
Germany much better off than I would have expected… as a German haha
Damn near impossible to conflate all the the housing economies represented across the U.S.
Hong Kong is a city. Why is it in here with countries? You’re comparing tadpoles to lemonade.
Living in the US. Good perspective but simplified not taking into account geography given the US size.
Interesting to see if it scales the same Rome vs NYC and Sydney vs LA. Then maybe a “mid-market” like Charlotte or Dallas vs whatever those may be in the top handful.
How is Singapore so cheap? When I lived there a decade ago, my rent was $3k for a 2 br apartment.
I guess it could be the whole 99 year lease instead of permanent ovmwnership, I guess
The worst onea are not even there. I am from Czechia and we are the worst together with Slovakia in whole EU. Its like 14-15 years if you check the data.
So Its kind of funny you Havel Italy, Denmark or Spain from EU with 6 years and then us with 13+ years.
I do not think the figures for the UK have not been calculated properly. The median property in England for 2024 was £295k – it would have been less for the UK as a whole, but use that as a basis.
The median “disposable” household income for the UK is £36700. Using that figure you would have a ratio of x8.0 which is close enough to the figure presented here, but is markedly different to how it’s described – median household income.
The median full-time worker (30+hours per week) earned £37400 in 2024. That would give a ratio of 7.9.
The median average worker (full timers plus part timers) would have earned around £33700 in 2024, and that comes out as a ratio of 8.8 shown here.
That makes me think that this graph shows the ratio of median property prices to an **individual worker’s income**, not a household’s income, which would be higher.
Is it the same for other countries?
The data is wrong. In Australia it’s 14.1x, not 8.8x
Source: The Australian Bureau of Statistics and their [Data By Region page](https://dbr.abs.gov.au/region.html?lyr=aus&rgn=AUS). In 2024, the median price of a house was $780,000. The median income was $55,000. That’s 14.1 times.
It’s much higher in cities like [Sydney](https://dbr.abs.gov.au/region.html?lyr=gccsa&rgn=1GSYD) (24x), and higher still in expensive suburbs like [Rose Bay](https://dbr.abs.gov.au/region.html?lyr=sa2&rgn=118011346) (88.75x)
Id like to see that with some sort of taxation adjustment.
Im Canadian, and I’d take HK ratios if it comes with the same tax rate
But the US is so terrible people are leaving in droves? 🤣 where are they going? 🤣
To my understanding the housing situation in Japan is pretty unique. Houses are financial liabilities that lose value over time, and they only last 20-30 years before being demolished.