Get insights on thousands of stocks from the global community of over 7 million individual investors at Simply Wall St.
-
If you are wondering whether Vermilion Energy’s current share price reflects its true worth, you are not alone. This article will walk you through what the numbers are saying about value.
-
The stock last closed at $15.51, with returns of 6.7% over 7 days, 13.6% over 30 days, 32.5% year to date, 51.8% over 1 year, negative 7.1% over 3 years and 64.6% over 5 years. This gives plenty of context for any view on potential future upside or risk.
-
These moves sit against a backdrop of ongoing sector headlines around commodity price volatility and shifting investor interest in energy producers. These factors can quickly change how the market prices companies like Vermilion Energy. Investors are weighing those broader themes alongside company specific updates when deciding what they are willing to pay for each share today.
-
Our valuation model currently gives Vermilion Energy a value score of 5 out of 6. Next we will walk through the different valuation approaches behind that number, before finishing with a way to look beyond the models and understand the story behind the valuation more clearly.
Find out why Vermilion Energy’s 51.8% return over the last year is lagging behind its peers.
A Discounted Cash Flow, or DCF, model projects a company’s future cash flows and then discounts them back to today’s value, aiming to estimate what the whole business could be worth right now.
For Vermilion Energy, the model used is a 2 Stage Free Cash Flow to Equity approach, based on cash flow projections in CA$. The latest twelve month free cash flow is CA$260.05 million. Analysts have provided several years of forecasts, and further out the cash flows are extrapolated, with the ten year projection in 2035 sitting at CA$214.38 million in free cash flow.
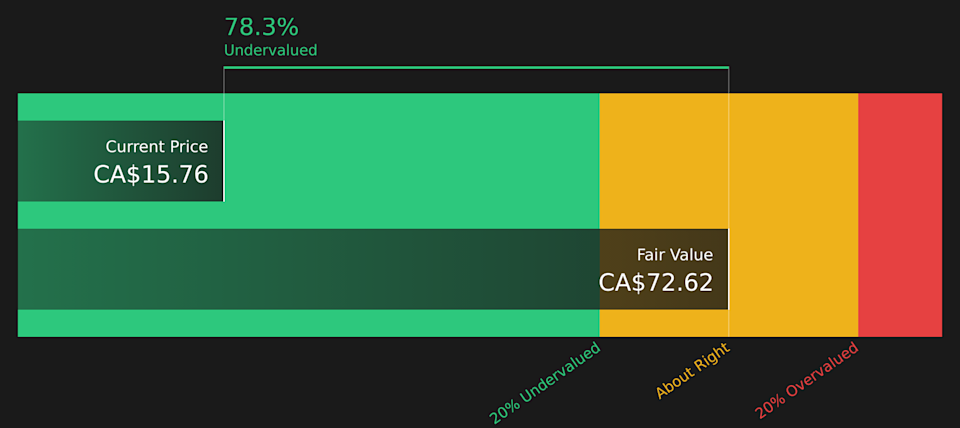
When all of those projected cash flows are discounted back to today, the model arrives at an estimated intrinsic value of CA$32.91 per share. Compared with the recent share price of CA$15.51, this implies a 52.9% discount, which suggests the shares are currently priced below this particular DCF estimate of value.
Result: UNDERVALUED
Our Discounted Cash Flow (DCF) analysis suggests Vermilion Energy is undervalued by 52.9%. Track this in your watchlist or portfolio, or discover 7 more high quality undervalued stocks.
VET Discounted Cash Flow as at Mar 2026
Head to the Valuation section of our Company Report for more details on how we arrive at this Fair Value for Vermilion Energy.
For a profitable producer like Vermilion Energy, the P/S ratio can be a useful way to sanity check the valuation because it compares what you pay per share with the revenue the business generates.
In simple terms, companies with stronger growth prospects or lower perceived risk often trade on a higher P/S, while slower growth or higher risk can justify a lower multiple. So there is no single “right” P/S. It depends on what investors expect from the business and how confident they feel about those expectations.
Vermilion Energy is currently trading on a P/S of 1.39x. That sits below the Oil and Gas industry average of 3.13x and below the peer group average of 4.16x. Simply Wall St’s proprietary Fair Ratio for Vermilion Energy is 2.41x, which is an estimate of what the P/S might be based on factors such as earnings growth, industry, profit margins, market cap and company specific risks. This Fair Ratio aims to be more tailored than a simple comparison with peers or the industry because it adjusts for those company characteristics.
Comparing the Fair Ratio of 2.41x with the current 1.39x P/S points to the shares trading below this model based estimate of a normal level.
Result: UNDERVALUED
TSX:VET P/S Ratio as at Mar 2026
P/S ratios tell one story, but what if the real opportunity lies elsewhere? Start investing in legacies, not executives. Discover our 3 top founder-led companies.
Earlier we mentioned that there is an even better way to understand valuation. Simply Wall St’s Narratives let you attach your own story about Vermilion Energy to the numbers by linking what you believe about its future revenue, earnings and margins to a financial forecast, a Fair Value, and finally a simple comparison with today’s price. All of this sits inside the Community page that millions of investors use. You can see this clearly in Vermilion where one Narrative might lean toward the higher Fair Value area around CA$15.74 to CA$17.00 based on a more optimistic view of German gas projects and the Westbrick acquisition. Another Narrative might sit closer to CA$13.00 or the bearish CA$10.50 price target because it focuses more on energy transition, regulation and financing risks. Each Narrative updates as fresh news or earnings arrive so you can quickly judge whether your Fair Value still stacks up against the current share price.
For Vermilion Energy, however, we will make it really easy for you with previews of two leading Vermilion Energy Narratives:
🐂 Vermilion Energy Bull Case
Fair Value: CA$15.74
Current price vs this Fair Value: about 1.5% below the narrative Fair Value
Modelled revenue growth: 148%
-
Frames Vermilion as a repositioned global gas producer with German deep gas and Montney assets that could support higher earnings, free cash flow and margins than analysts currently build into their base cases.
-
Assumes a shift toward stronger profitability over time, using a higher profit margin and a future P/E of 16.0x with a 6.49% discount rate to arrive at a Fair Value near CA$15.74 per share.
-
Flags meaningful risks around European gas exposure, leverage of more than $2b, aging assets, decommissioning costs and long run energy transition pressures that could constrain cash flow and capital access.
🐻 Vermilion Energy Bear Case
Fair Value: CA$14.64
Current price vs this Fair Value: about 6.0% above the narrative Fair Value
Modelled revenue growth: 122%
-
Centers on analyst consensus around Vermilion’s global gas portfolio, German deep gas projects and the Westbrick acquisition, with these factors already built into expectations for reserves, production and cash flow.
-
Uses a Fair Value of CA$14.64 per share that reflects a 6.43% discount rate, a profit margin assumption of about 6.0% and a future P/E of roughly 21.0x, implying the business already carries a relatively full earnings multiple.
-
Highlights execution risk on growth projects and acquisitions, the impact of high net debt, geopolitical and regulatory uncertainty and the possibility that returns on early stage projects do not fully match the optimism in current forecasts.
If you want to see how these viewpoints are built up from the numbers and assumptions, you can step through the full narratives that investors have shared for Vermilion and compare them with your own expectations about the business.
Do you think there’s more to the story for Vermilion Energy? Head over to our Community to see what others are saying!
TSX:VET 1-Year Stock Price Chart
This article by Simply Wall St is general in nature. We provide commentary based on historical data and analyst forecasts only using an unbiased methodology and our articles are not intended to be financial advice. It does not constitute a recommendation to buy or sell any stock, and does not take account of your objectives, or your financial situation. We aim to bring you long-term focused analysis driven by fundamental data. Note that our analysis may not factor in the latest price-sensitive company announcements or qualitative material. Simply Wall St has no position in any stocks mentioned.
Companies discussed in this article include VET.TO.
Have feedback on this article? Concerned about the content? Get in touch with us directly. Alternatively, email editorial-team@simplywallst.com

 Pricing Reflect Its Strong Recent Share Price Performance")