
![U.S. Jobs Added/Lost (non-farm) [OC]](https://www.byteseu.com/wp-content/uploads/2026/03/qsmnpck6ogng1-1536x1493.png "U.S. Jobs Added/Lost (non-farm) [OC]")
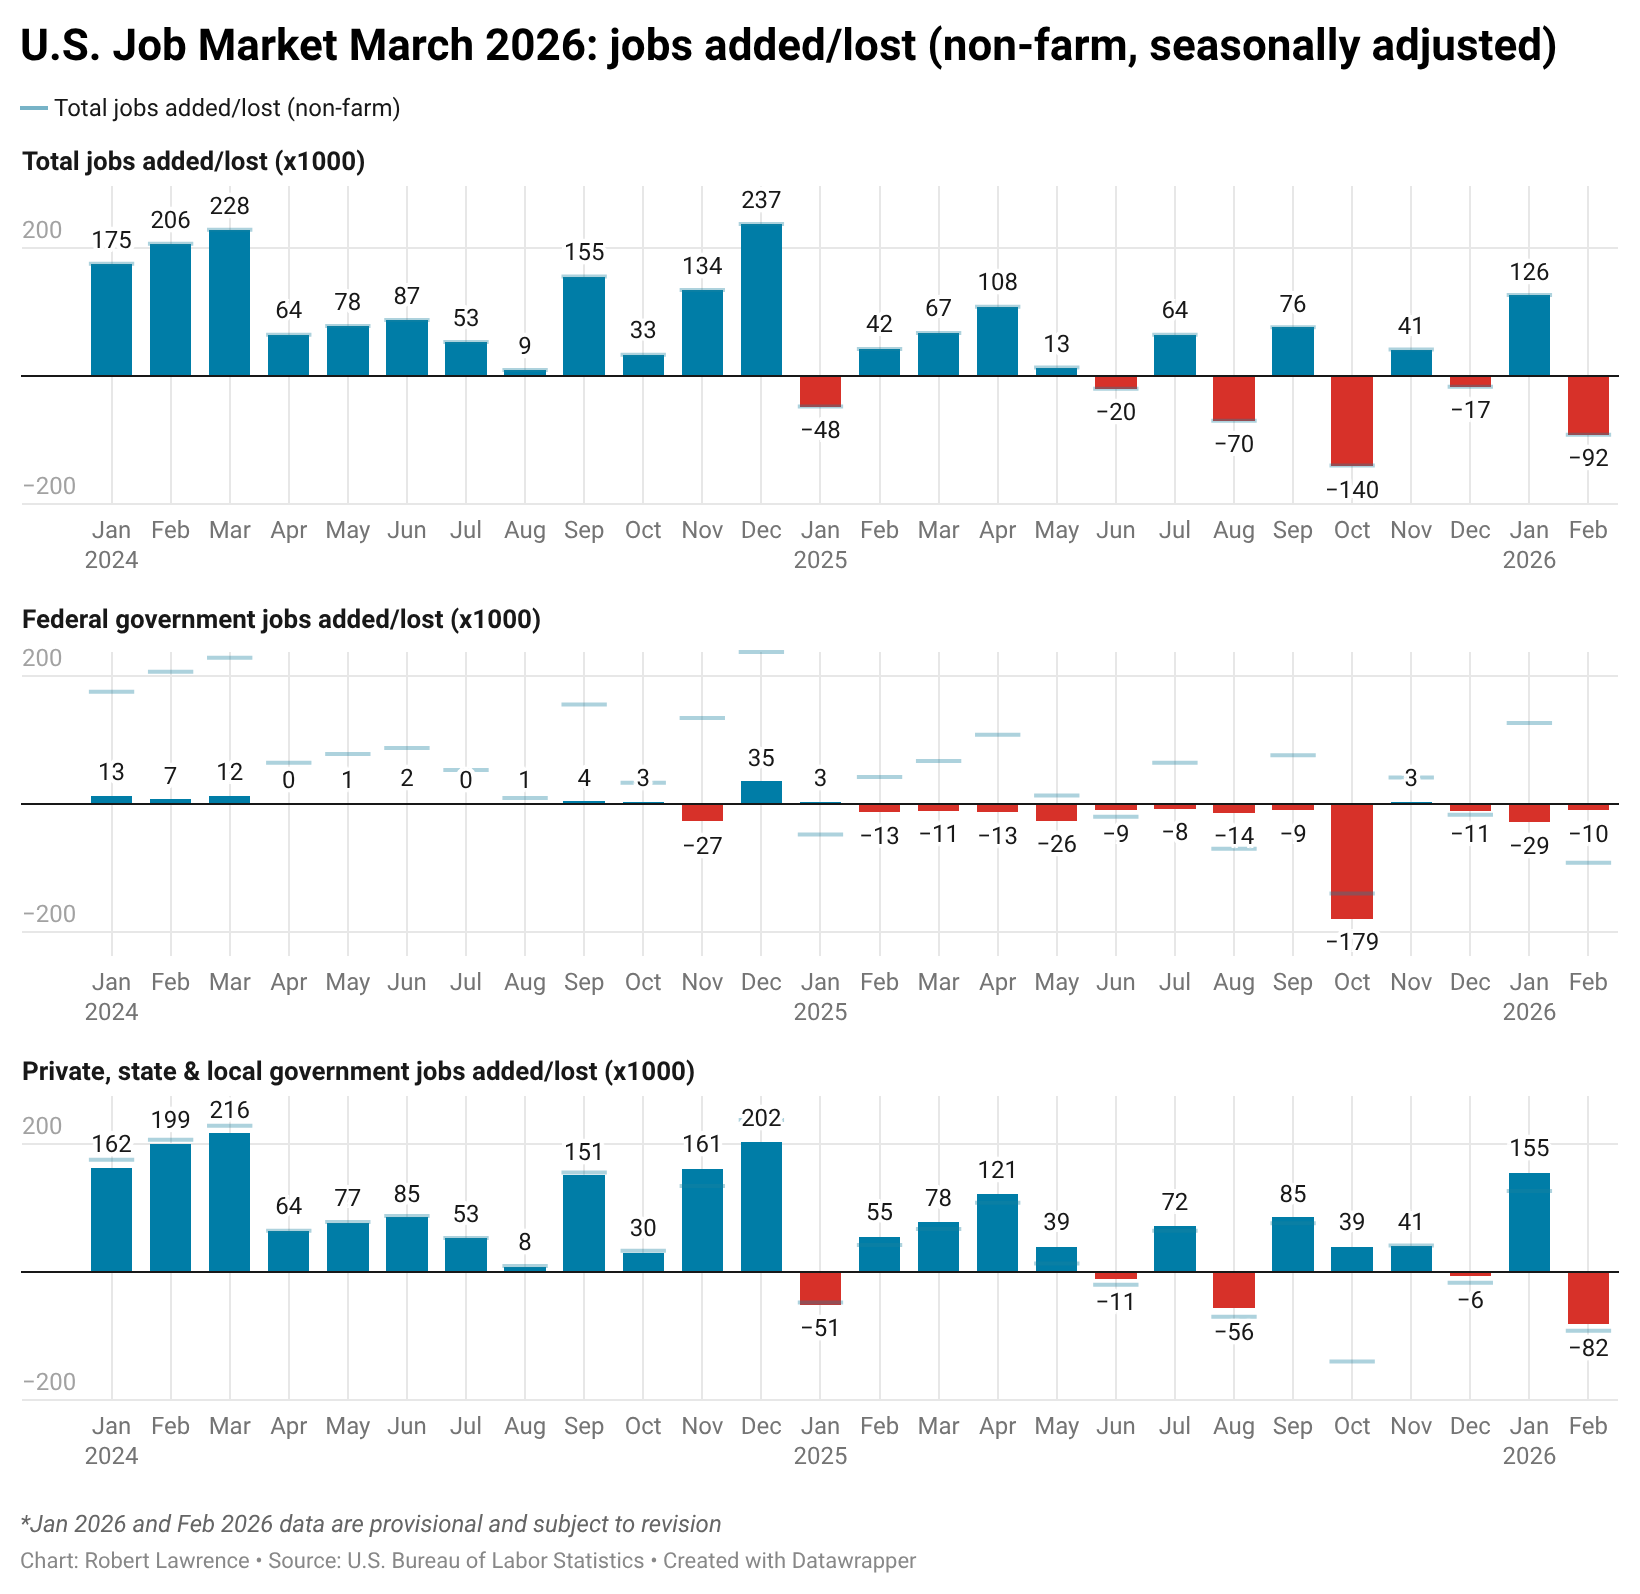
Monthly numbers from the U.S. Bureau of Labor Statistics, going back to January 2024. The top chart is total jobs, excluding those in farming (which BSL counts separately). The middle chart separates out the jobs/added lost in the Federal Government sector to highlight the impact of DOGE. The bottom chart is the non-Federal Government jobs, mostly in the private sector but also inclusive of state and local government jobs. Overlays in the bottom two charts are the total numbers in the top chart. Created in Datawrapper: https://www.datawrapper.de/_/xnGKG/
BLS March report: https://www.bls.gov/news.release/empsit.nr0.htm
BLS report Total Nonfarm Employment – Seasonally Adjusted CES0000000001: https://data.bls.gov/toppicks?survey=bls
Posted by CognitiveFeedback
4 Comments
Notably, the BLS has reported downward revisions 13 months in a row: https://www.bls.gov/web/empsit/cesnaicsrev.htm
The last upward revision to the originally-released month-over-month seasonally-adjusted Nonfarm Payroll Employment was December 2024.
Hmm. Seems like there was some shift that occurred in Jan 2025…
Thank a Republican, this is all based on their policies.
Lets remember that so we don’t do this every several years.
I’d be curious to see the last chart separated out into private only and state+local.
How much of the hiring is state/local compensating for the loss of federal workers?