
![[OC] I simulated 10,000 stock price paths using Monte Carlo + Geometric Brownian Motion](https://www.byteseu.com/wp-content/uploads/2026/03/pfe3iywjygng1-1536x963.png "[OC] I simulated 10,000 stock price paths using Monte Carlo + Geometric Brownian Motion")
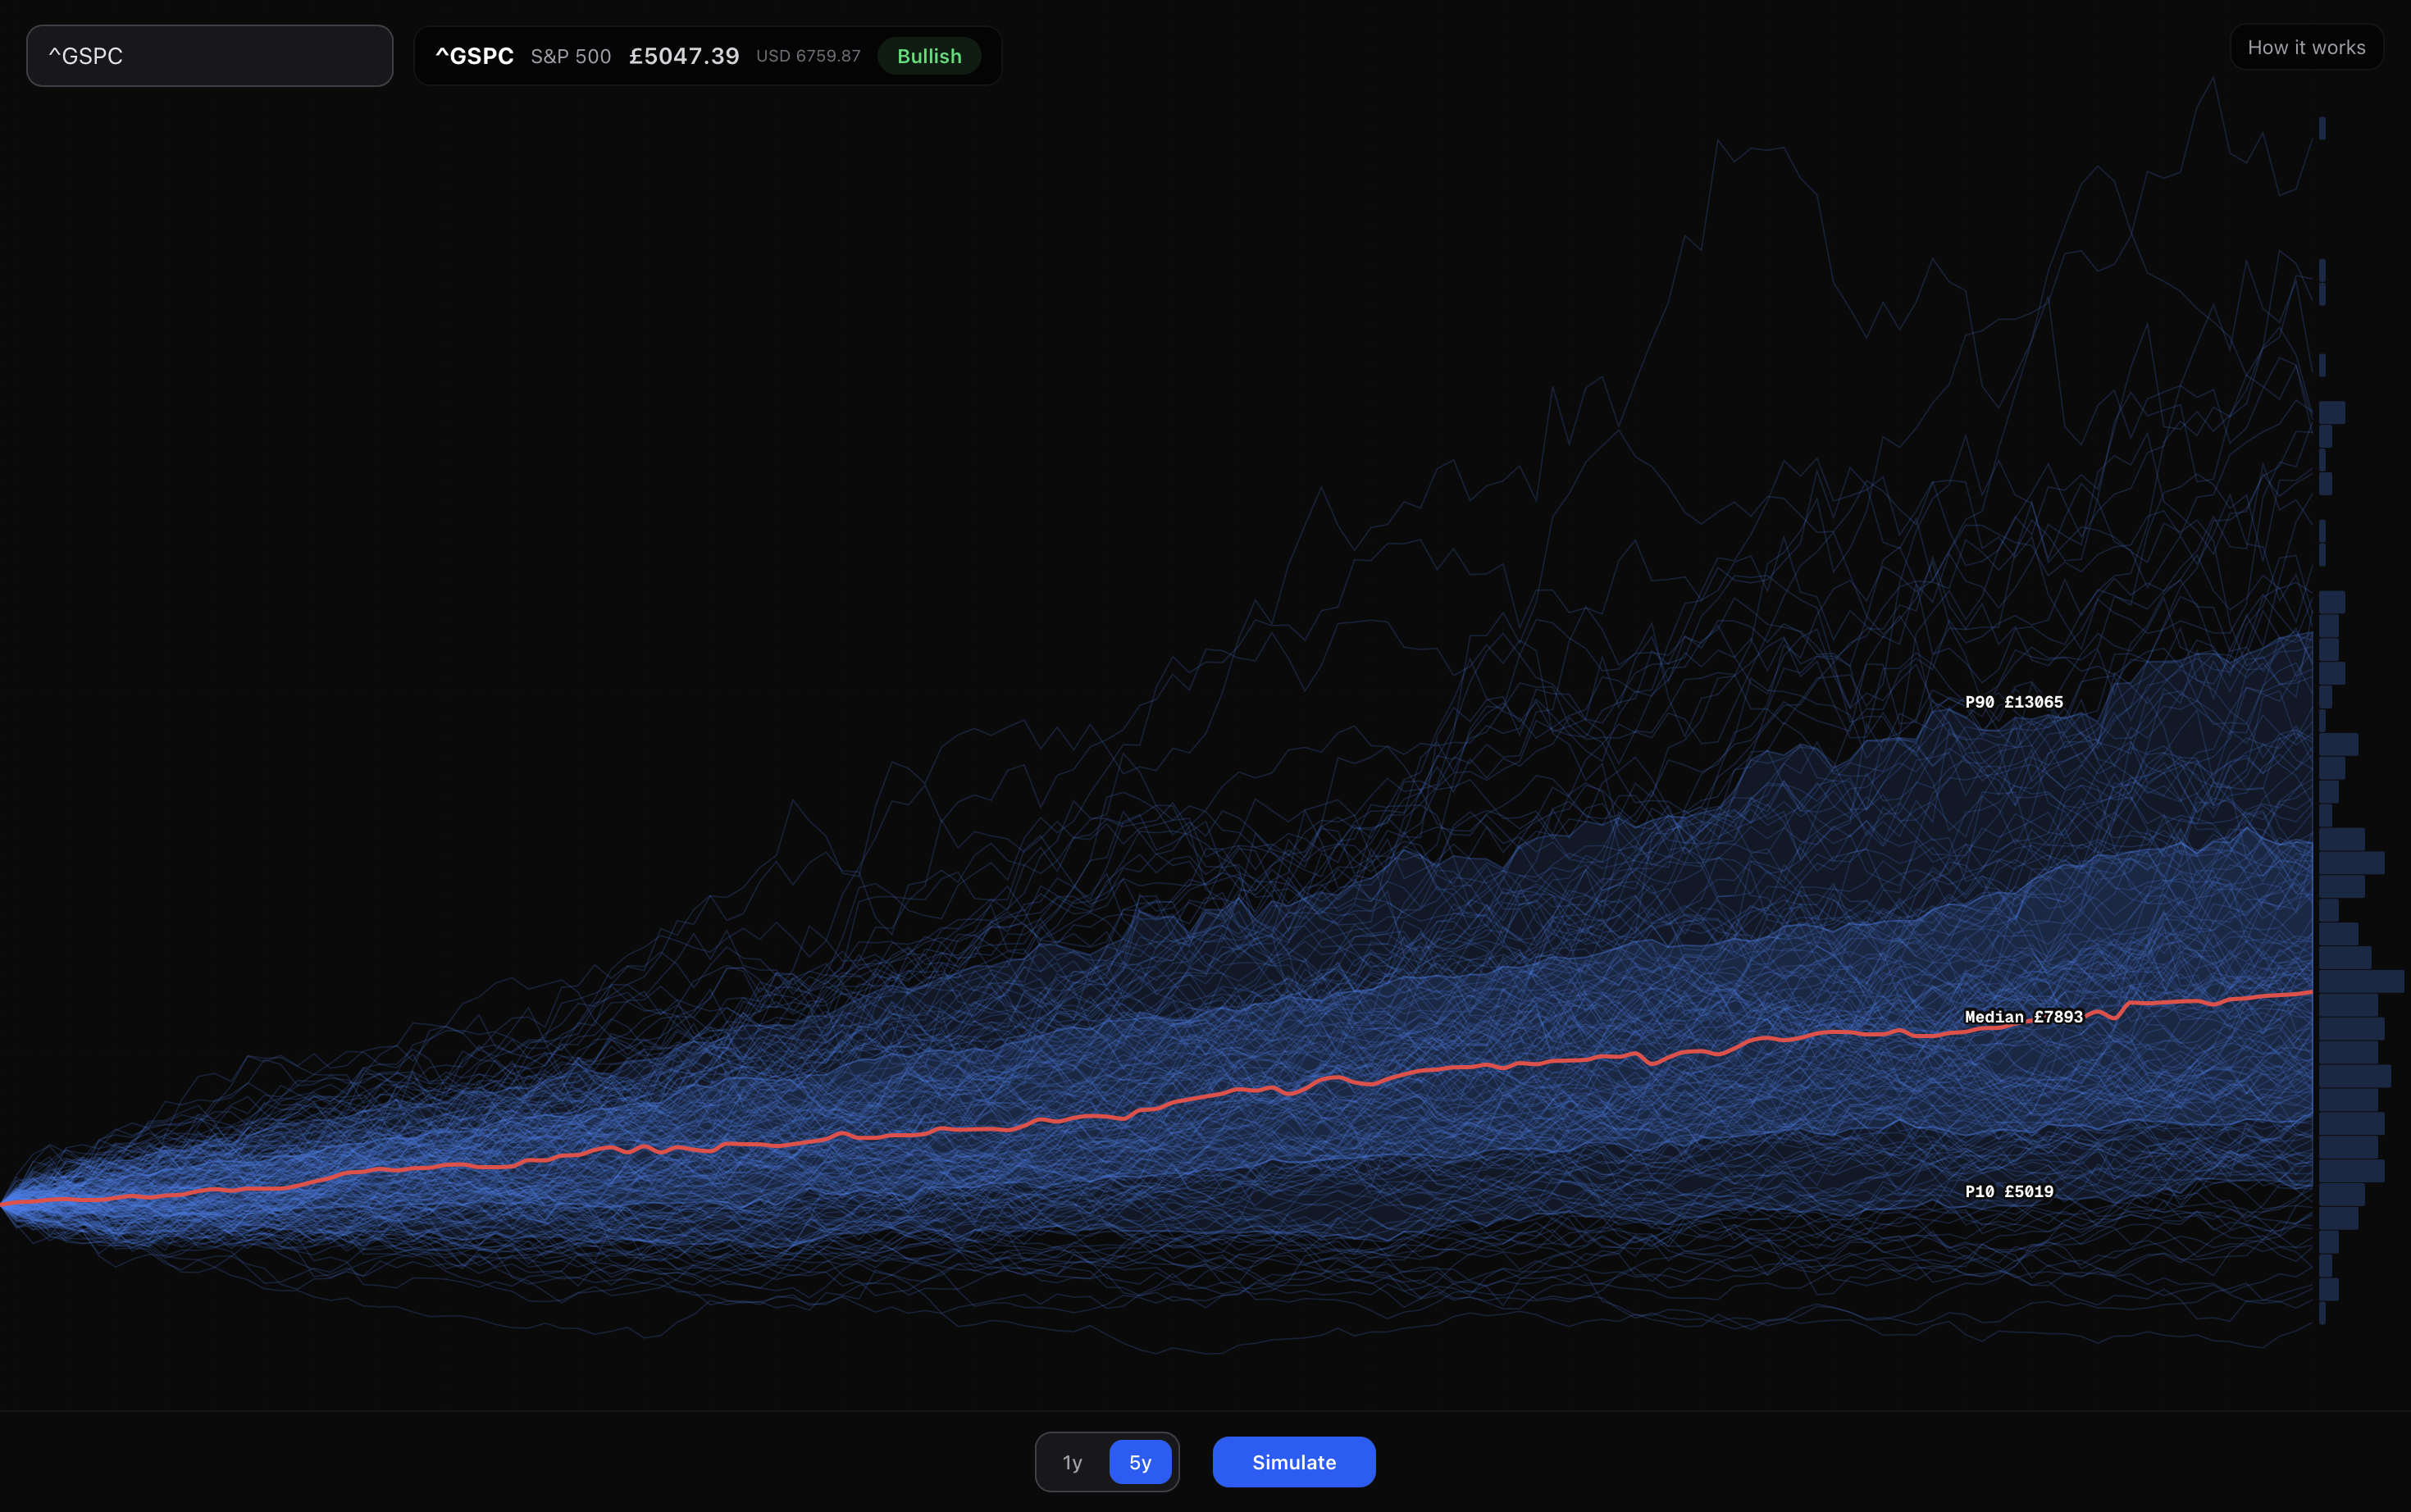
Each line is a possible future for the S&P500 over the next five years, modelled using Geometric Brownian Motion with historical volatility and drift.
Built this as a free interactive tool so anyone can run their own simulations. Drop a ticker, adjust volatility and time horizon, and watch the paths generate in real time.
Tool: monte.rorymurray.uk
Happy to answer questions on the GBM model or the math behind it.
Posted by Both-Hat-1758
11 Comments
can i do this too if yes how
https://preview.redd.it/ldijotbx9hng1.png?width=2940&format=png&auto=webp&s=9d3f811c518353db718bd918d3d0431aeb18544f
😍
I thought markets were fat tails distributions
Beautiful visualization. The subtle gradient on the density of the paths makes it so easy to read the probability distribution at a glance.
Always love seeing custom interactive data tools built for the web. I’m working on something in a similar vein for 3D mapping called **HeatGlobe** ([https://heatglobe.com](https://heatglobe.com/)).
What charting library did you use for this, or did you build the visualizer from scratch?
Question: does showing the simulations show anything that just showing the log normal distribution doesn’t?
Have you tried applying this methodology retrospectively and then comparing your results with what actually happened?
Are you using a normal distribution with mean amd standard deviation of daily returns or are you accounting for the skew and kurtosis of the returns by using a Pearson distribution?
what in the fuck happens at the top line????
tl:dr: line goes up as time goes on
I don’t really understand what this means, could you explain. I don’t see how using past volatility or drift could simulate future value, this prediction is very dependent on S&P performing the same just with a confidence interval. Its not really a prediction model (classification , regression model etc)
I’m sorry, but how exactly is brownian motion at all relevant to stock market tickers?? Brownian motion describes the motion of a microscopic particle based on the interactions of gas or liquid molecules on that particle. It is not a valid way to describe random choices that could affect a stock market ticker