Paris publishes its budget data as raw CSVs and PDFs. We built an open-source platform that transforms this into interactive visualizations anyone can explore.
This chart breaks down the city’s budget into 11 thematic categories and shows how much each Parisian effectively “pays” per day. The biggest slices: personnel & admin, social services and urban planning.
Source: Open data from [opendata.paris.fr](http://opendata.paris.fr), processed through a dbt/BigQuery pipeline.
Interesting, I wonder how that compares to cities like NYC or SF
HeatGlobe on
Breaking this down to ~14.4 € per day per person is a really clever way to contextualize an €11.7B budget. It makes the macro numbers feel much more tangible. I’m actually surprised ‘Personnel & Admin’ barely edges out ‘Action Sociale’!
Fusken on
Uff, interest payments nearly as much as education? Wow
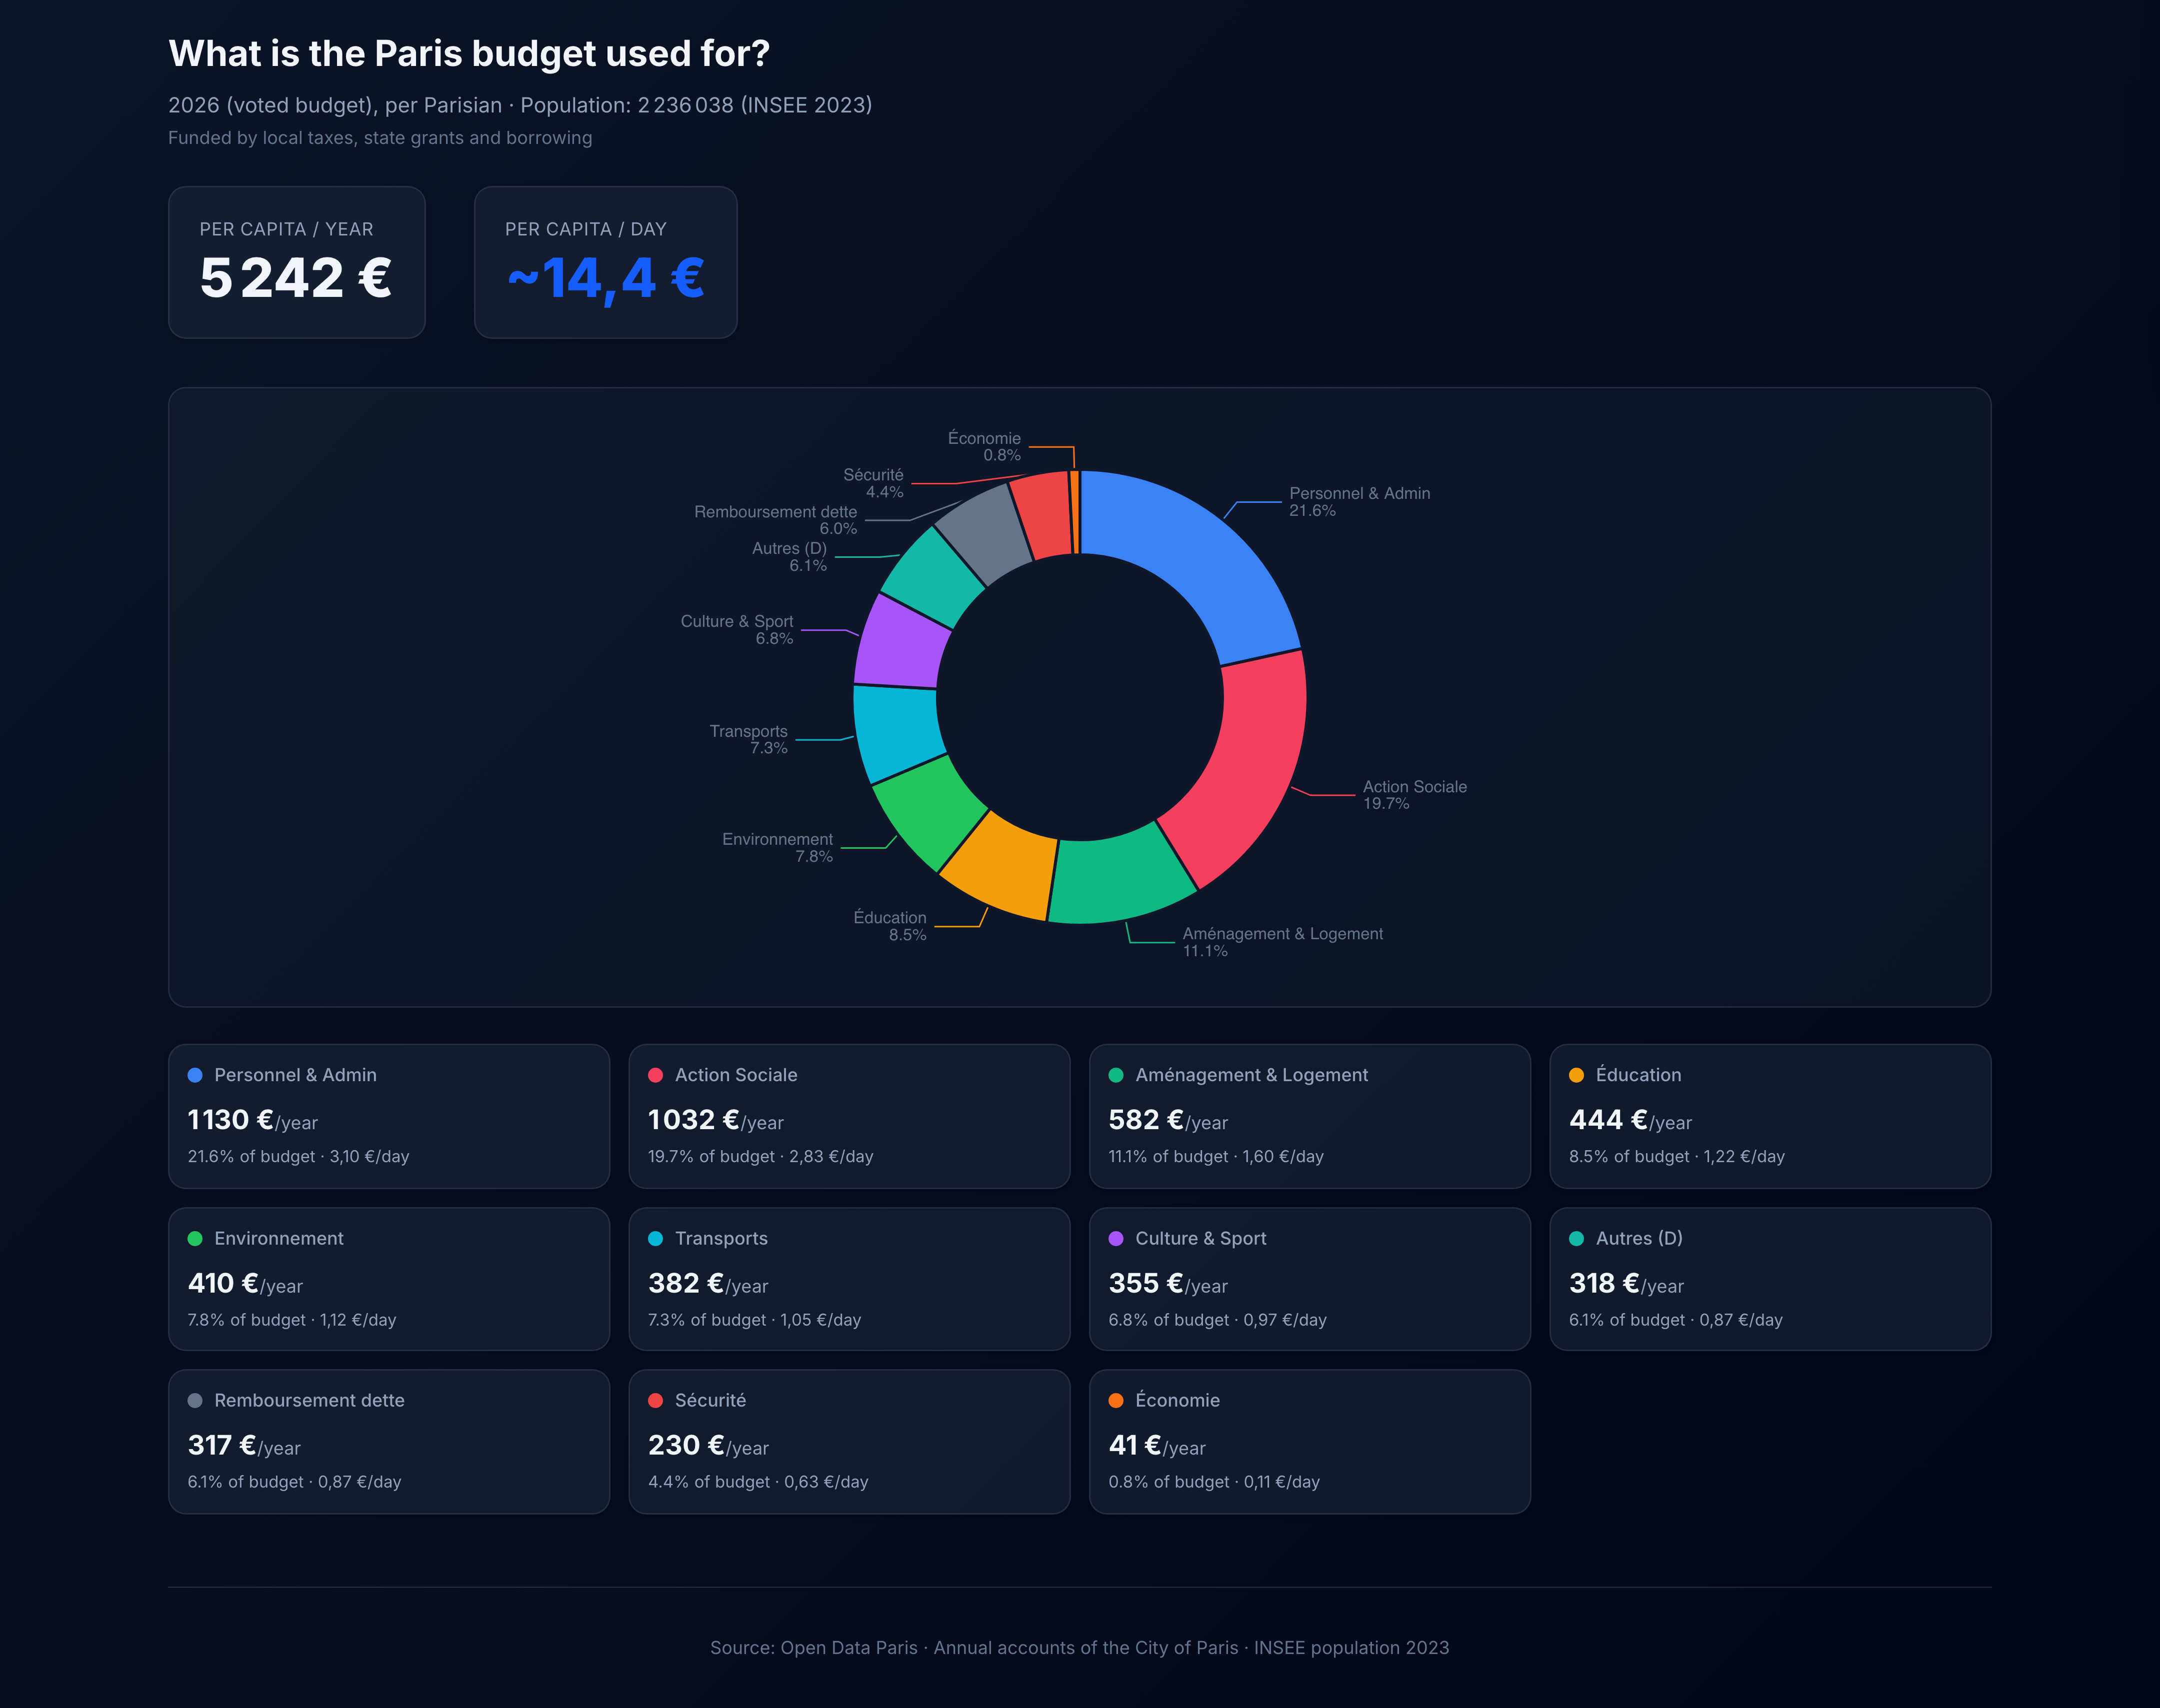

![[OC] How Paris spends your money: a per-capita breakdown of the city's EUR 11.7B budget](https://www.byteseu.com/wp-content/uploads/2026/03/dtqfhhef1nng1-1536x1215.png "[OC] How Paris spends your money: a per-capita breakdown of the city’s EUR 11.7B budget")
5 Comments
Paris publishes its budget data as raw CSVs and PDFs. We built an open-source platform that transforms this into interactive visualizations anyone can explore.
This chart breaks down the city’s budget into 11 thematic categories and shows how much each Parisian effectively “pays” per day. The biggest slices: personnel & admin, social services and urban planning.
Source: Open data from [opendata.paris.fr](http://opendata.paris.fr), processed through a dbt/BigQuery pipeline.
Tool: Next.js + Recharts, fully open source at [github.com/Nuttux/france-open-data](http://github.com/Nuttux/france-open-data)
Explore the full interactive version: [https://franceopendata.org/tableau-de-bord](https://franceopendata.org/tableau-de-bord)
Interesting, I wonder how that compares to cities like NYC or SF
Breaking this down to ~14.4 € per day per person is a really clever way to contextualize an €11.7B budget. It makes the macro numbers feel much more tangible. I’m actually surprised ‘Personnel & Admin’ barely edges out ‘Action Sociale’!
Uff, interest payments nearly as much as education? Wow
C’est vrm bien fait, merci