
![[OC] Oil efficiency of GDP: linking economic output to oil consumption](https://www.byteseu.com/wp-content/uploads/2026/03/8xcqttswn0og1-1536x1152.png "[OC] Oil efficiency of GDP: linking economic output to oil consumption")
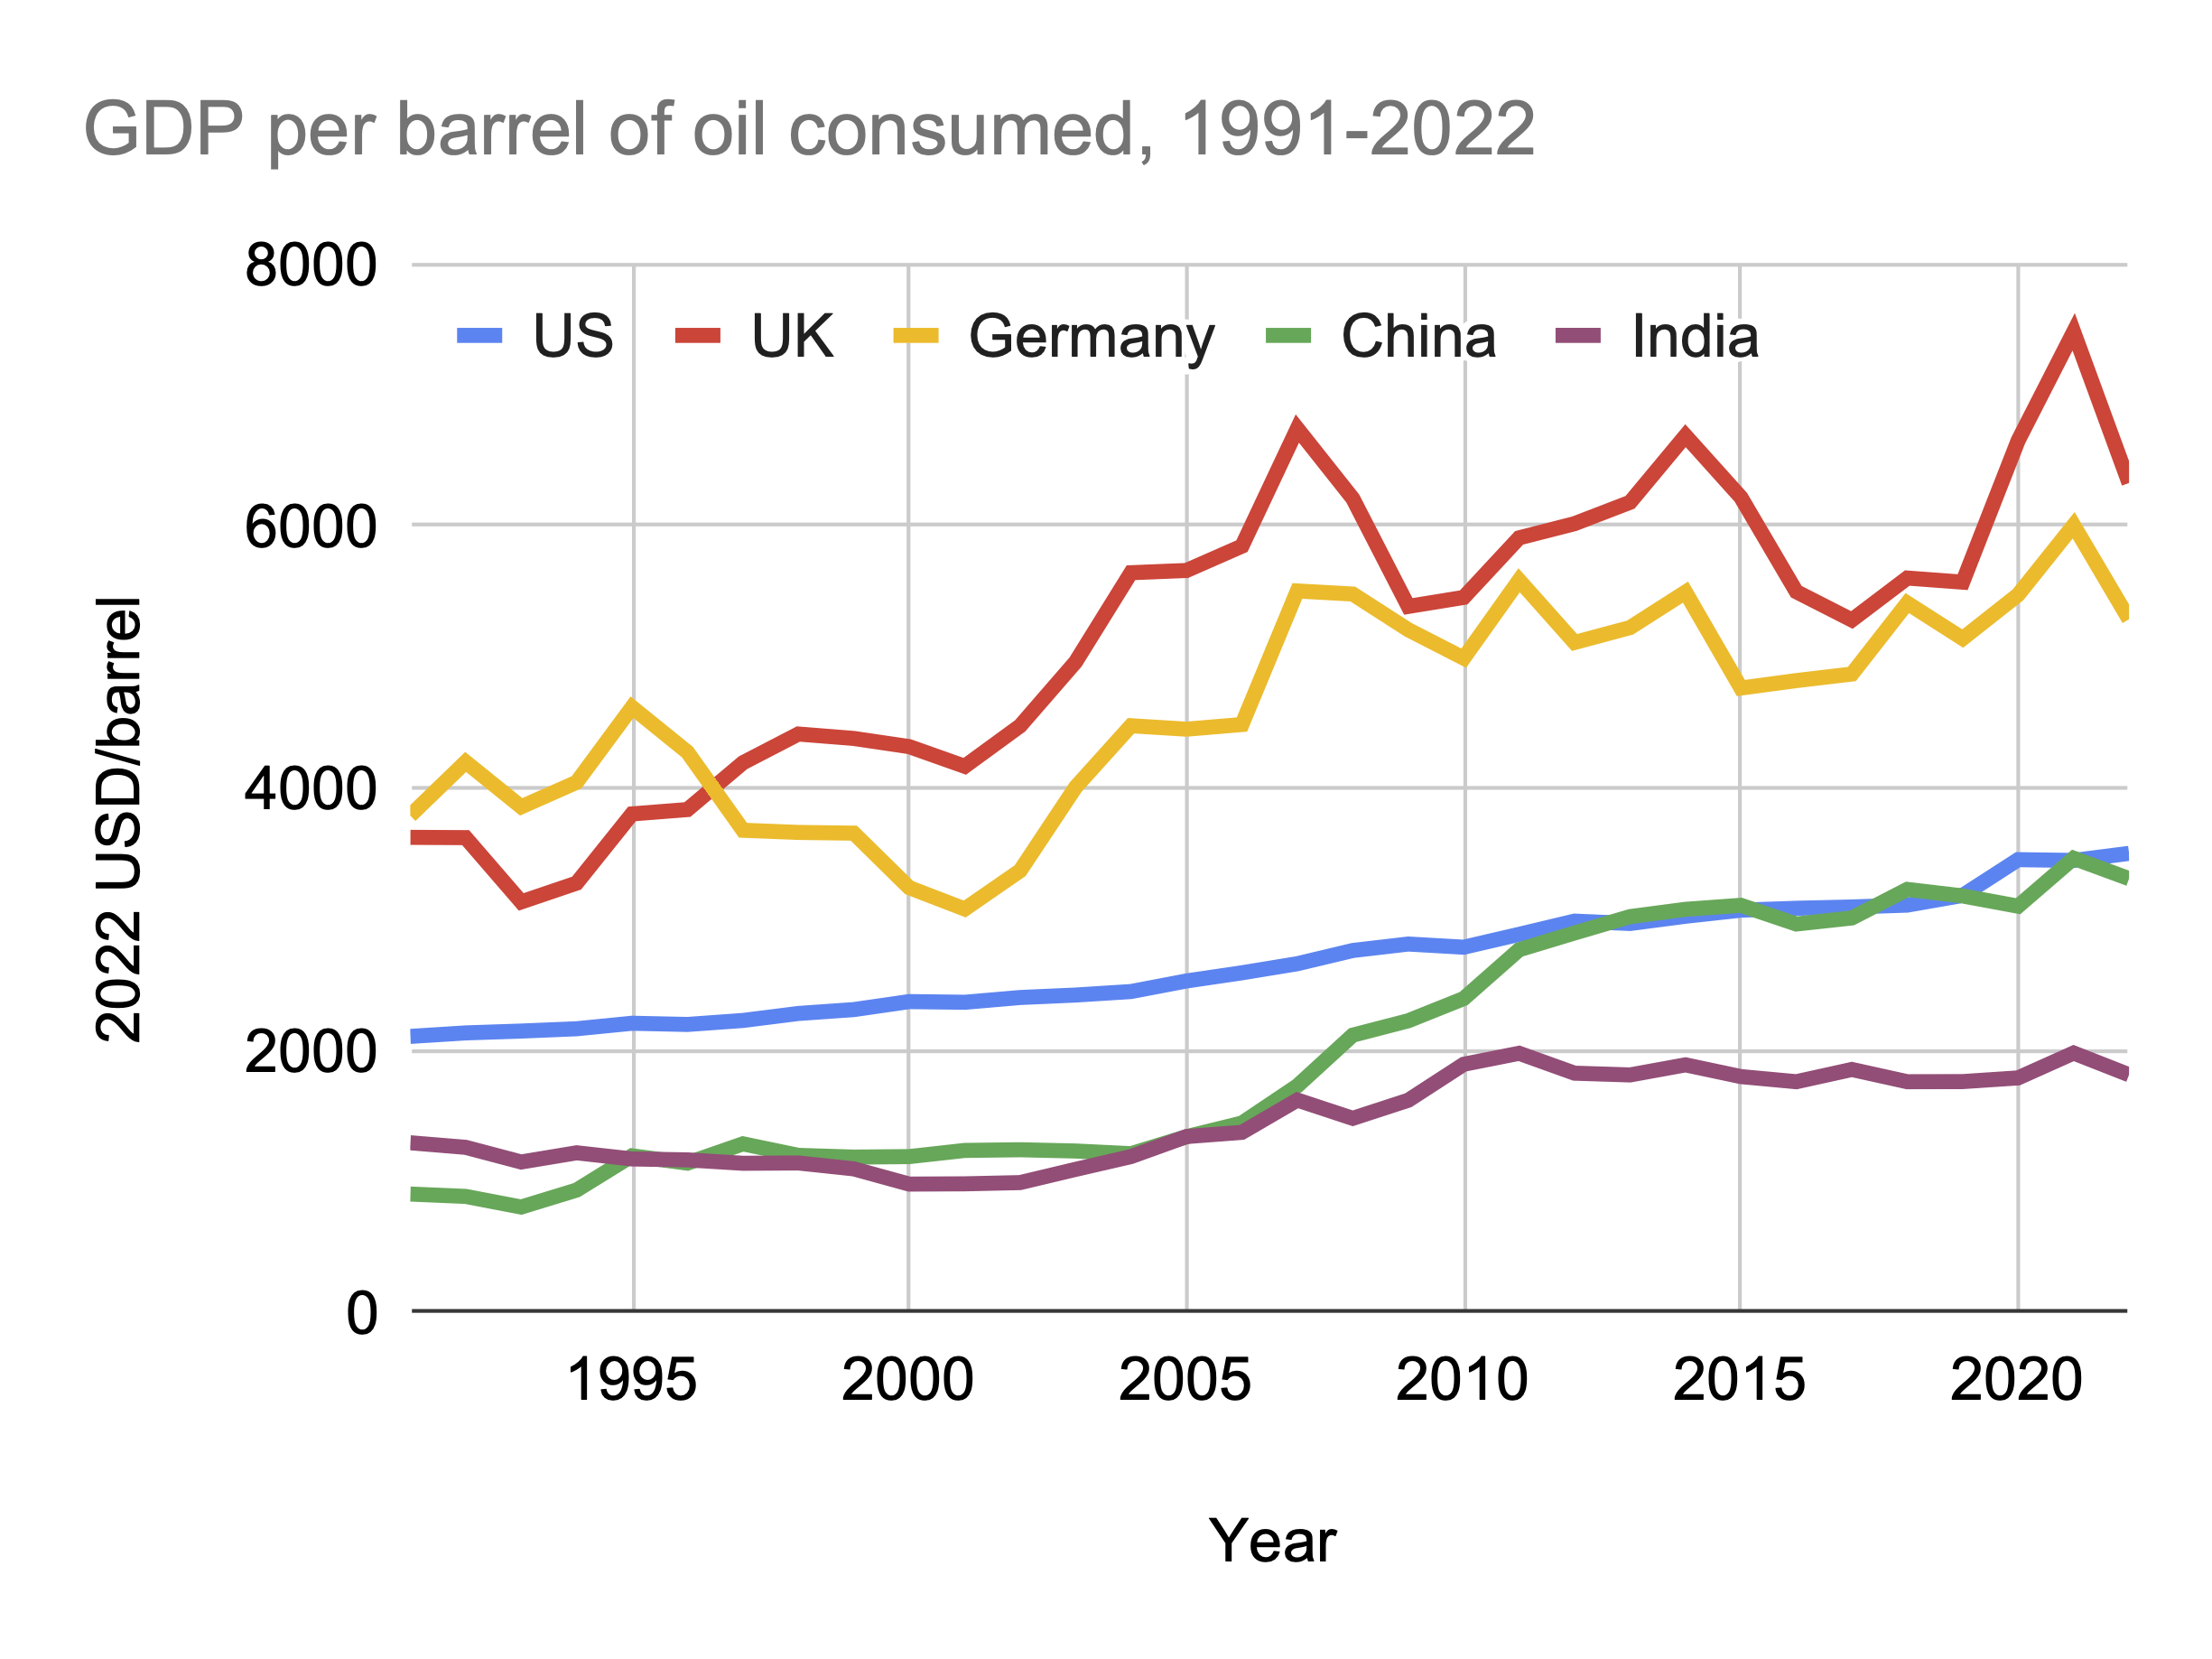
How dependent are global economies on oil? This graph shows the ratio of GDP to oil consumption, in constant 2022 USD per barrel, for five example nations.
Some notes:
1) National economies generally grow faster than their oil consumption, as they become more energy-efficient and their economies shift toward activities that require less oil. As authors like Paul Krugman have pointed out, the US economy is much less oil-dependent than it was during the 1979 energy crisis, and the same is true everywhere.
2) Moderately-developed countries generally have a poor oil efficiency of GDP, as they work to provide baseline transportation and power to a low-income economy.
3) Western European countries generally are very oil-efficient, thanks to increased focus on renewable energy and a focus on industries that use less oil.
A warning:
While I created this graph to help you think about which countries might be worst-affected by a sudden spike in oil prices, remember that the non-oil-using parts of an economy are totally dependent on the oil-using parts. For instance, the tourist industry doesn't use much oil, but it depends on the aviation industry which does.
Economies are not just machines that take in oil and spit out money!
Data sources and methods:
Data accessed and downloaded through Wolfram Alpha, formatted and visualized with Google Sheets.
Here's a Wolfram Alpha link to use if you want to compare your favorite country:
Posted by agate_
7 Comments
Knowledge work (finance, consulting, healthcare, tech etc) will form the biggest chunk of developed economies but won’t contribute significantly to oil consumption.
Except that I guess that the people who work these well paid jobs will be big consumers and their *demand* will consume a lot of oil, but the work won’t.
Why does Germany and the UK’s line rise and fall so sharply, whereas the other countries are smoother?
A highly restricted therefore invalid sample to arrive at your conclusions. Using Wolfram Alpha is not a get-out-of-analysis card. There is no such thing as a “favourite country” when doing these things. Five samples out of say 180? In which universe is this permissible?
No mention of the structure of the UK economy versus that of Germany, no mention of domestic oil prices, no mention of countries at comparable development to China or India, no mention of anything that might or might not support the conclusion you wanted to draw, rather than an honest search for answers.
It would be a failing grade at school, let alone university, and thrown away without looking at any reputable company where your supervisor wasn’t illiterate.
The above may seem intemperate but this is really poor quality “analysis”.
This is an interesting statistic that I’m still trying to chew on.
Countries who are productive but depend highly on oil will score high on this graph. Countries who are productive but oil-independent will score lower. Countries who are highly reliant on oil but have bad GDP will also score low.
Wouldn’t number of oil barrels consumed per basis point of GDP growth be a better metric?
the interesting outlier in these comparisons is usually switzerland or similar small high-income countries – they get unusually high GDP per barrel because the economy is weighted toward finance and services rather than manufacturing or agriculture. the inverse tells you almost as much about what kind of economy a country runs as any other single metric. energy intensity of GDP is one of the cleaner signals for industrial composition
To me, this is a cool graph, but is ultimately really focusing on oil usage and therefore over ranking countries further on the green transition. I think it would be very cool to see the same graph, but per joule of energy consumed – that would really show “efficiency”