
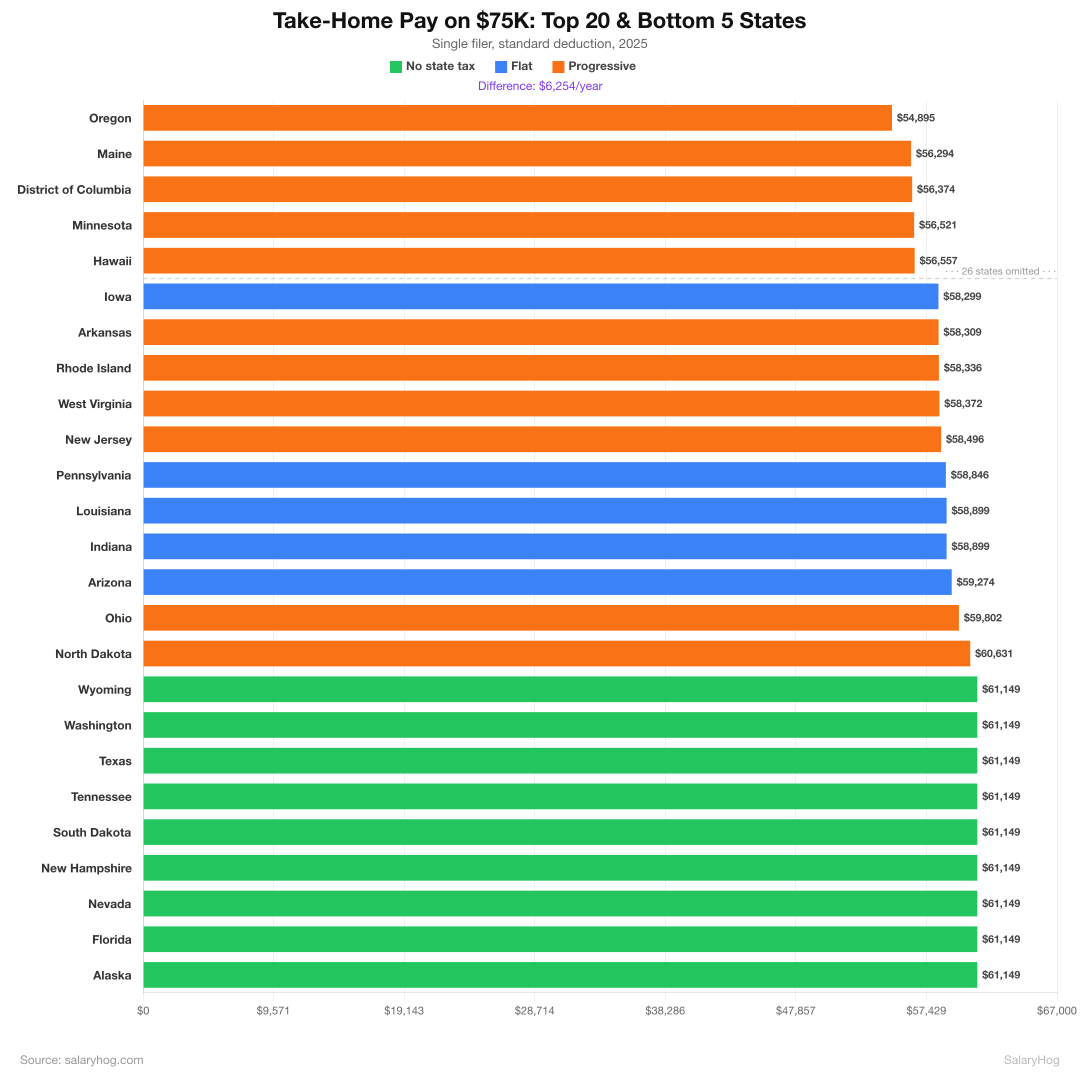
![[OC] Take-home pay on a $75,000 salary in all 50 states (resubmitted with fixes)](https://www.byteseu.com/wp-content/uploads/2026/03/zufF97MQXCuOWKxwS9IaKCTkXRuDEVpZ1OcDoFbnapg-1024x1024.png "[OC] Take-home pay on a $75,000 salary in all 50 states (resubmitted with fixes)")
Resubmitting as a link post per Rule 2 (got flagged because I did it wrong–now you have to go to my blog to see both images. This was my first post!). I took the feedback from the first round seriously.
What I fixed: The original version had a truncated x-axis starting at $53K, which rightfully got called out. I also cleaned up the labeling and readability. Bonus: I added color by tax structure. It takes away the rainbow effect that makes bar charts look sexy. I know bar charts have limitations .
What I didn't add (and why): A lot of people asked about property tax, sales tax, and cost of living. I intentionally left these out. This is strictly paycheck math. What hits your check before you spend a dime. Property tax varies by county, not state. Sales tax varies by city. And cost of living is an entirely different analysis. Mixing them together would mean making dozens of assumptions about housing prices, spending habits, and where in each state you live. That's a different project. This one answers a simpler question: if two people earn $75K and one lives in Oregon and the other in Texas, how much does each see on their paycheck?
Methodology: Single filer, standard deduction ($15,000), 2025 federal brackets, each state's income tax rates, Social Security (6.2%), Medicare (1.45%). I built a calculator at salaryhog.com that does this for any salary and state.
Tools: Next.js, Chart.js
Posted by coronassun
31 Comments
[deleted]
Oregon is the lowest take-home from this analysis, but this absolutely doesn’t factor in the Oregon kicker, which typically returns a significant portion of tax paid every other year and no state sales tax.
Just shows the challenge of truly capturing the overall tax burden, which has so many variables and idiosyncrasies.
Take home doesn’t mean shit when basic needs are taxed through the roof at point of sale.
South Dakota doesn’t have income tax but all food and clothing is going to cost you between 6 and 8+% more, and you’re going to have additional excise taxes on the Purchase of a Vehicle which must be still paid even if you bring one from out of State.
Haha try living on $75000 in Alaska 🤣 All the gas and grocery prices the L48 bitch about is our norm.
Weird axis breakpoints, labels not scaled to bar lengths. Not beautiful yet.
Imo it’d be far easier to interpret if the X axis went from $0-75k, and you changed the x aspect ratio by about a half or two thirds. It doesn’t need to be nearly as wide. 80% of the graph is wasted space.
I gladly pay whatever the cost is not to have to live in, as the President would say, a shithole country in the South.
How is California not right there with Oregon?
Edit: Thank you to those who chimed in to educate me. Always assumed it was around 10% state income tax.
You’re not accounting for states that do and don’t allow deductions at the state level…
Good to know I save a whopping ~$1,000 to be last in Education, life expectancy, or anything else good compared to California. Not that it matters since we also pay the highest sales tax in the country so that $1,000 is gone anyway just in the taxes on my bills.
$75,000 USD today is £55,695 (GBP)
Take home pay would be £42,860.50
Which is $57,212.98 (USD).
Not far behind and yet we have free healthcare, 5.6 weeks’ paid holiday a year, paternity leave, sick leave, employment rights…
Oregon also has no Sales Tax, and lower than normal property taxes.
Tennessee has no income taxes, but almost 10% sales tax.
Income tax is progressive, it hits rich people, sales tax is regressive, it hits poor people.
this is meaningless without living cost adjustments
Yeah, I’d rather see total state tax revenue compared to total income, so none of the different tax sources like sales and property get hidden.
But then after that you have to somehow compare the services the state offers and the level at which they are provided. All else equal, I’d prefer a state with more services, obviously.
It’s just a difficult calculation. Like if property tax is low I probably wouldn’t get the most out of that because I don’t need a mansion. So that kind of state wouldn’t be for me but would for others.
so dumb, WA has no income tax; but good luck buying anything in king county
>What I didn’t add (and why): …Property tax varies by county, not state. Sales tax varies by city.
For what it’s worth, lots of cities and counties have their own income taxes too. These rates in the graph could still vary based on where you live in each state.
Does this include the Paid Leave Oregon tax? Because that’s more like short term disability insurance and, anecdotally, I’ve heard that it meaningfully replaces one’s salary when you’re out of work with surgery, etc. But yes our taxes are wicked high.
Wow, you guys are getting rorted something shocking. There is a single tax rate in Australia for all states. on a $75,000 income, [you would be taxed $13,288.00](https://www.ato.gov.au/calculators-and-tools/tax-return-simple-tax-calculator)
So, take home is $61,712. That’s higher than all your states. And we get free healthcare, and (in the capitals) decent public transport. Things can be more expensive, but at least we don’t get slugged “random percent” at checkout either.
Good luck with those Florida sales taxes and property taxes.
Mississippi has no state tax now.
Alaska should be at the very top of the list above the other no-income-tax states since the state *pays* its citizens to live there with [Permanent Fund Dividend](https://en.wikipedia.org/wiki/Alaska_Permanent_Fund) checks.
Suggestion: a version where it’s married filing jointly. Might have to assume no kids or maybe a no kid and 1 kid version for dependents?
It’s interesting to look at a lot of tax and net worth comparisons like this, but if you’re married, it loses some value, because there are additional rules and deductions that kick in
If you factored ever tax california levies, it would be in the top 3. Doesn’t even appear here.
bullshit analysis . doesn’t factor in so many other factors of living in a state.
all these rich people flashing their homes they take their paychecks to.
Everyone is pointing out much of the same – which is that this doesn’t paint even half the picture when it comes to regional / state by state affordability.
For example – I live in GA. My MIL lives in NJ.
She owns are 3 bedroom 2 bath home 1,800 sqft. She bought it for $325k around 2015. She pays over $14,000 a year in property taxes today.
I own a 4 bedroom, 3 bath, 2,800 sqft. Bought in 2021 for $425,000. I pay less than $5k a year in property taxes.
Cost of living is a huge factor, and my money goes way further in GA than it would in NJ.
According to this chart, I pay a few thousand dollars more in state taxes living in GA vs. NJ. But almost everywhere in NJ has aggressive local taxes, and insane property taxes.
So my home is cheaper. I’m building equity faster. I’m being taxed a little more by the state, but not getting destroyed by property taxes, or local / municipal taxes…
There are just too many variables.
This exercise is mostly meaningless.
In Canada, with a $75,000 gross pay
Lowest take home is Nova Scotia at $53,158
Highest take home is British Columbia at $57,640
Taxes are complex and this really doesn’t reflex the most regressive tax ever created the Business and Occupation Tax. Washington makes even Texas which is around a 13% tax burden for lower income look calm compared to it’s 18% …
Washington and Texas btw are you bottom two by most analysts not Oregon.
What about states like FL that don’t charge tax on food and have homestead exemption on primary residence vs TN which charges tax on food…
Meaningless without Cost of Living comparison
So California comes out better even though they are significantly worse in reality.
I always use [smart assets calc](https://smartasset.com/taxes/california-tax-calculator#U7a988Zpdh), and it gets $58,398 for single filers/CA/2025 brackets vs. your $57,631. I wonder which is correct and where the discrepancy is.