
")
Dear all,
Here is my political compass app.
This is a side project from Brussels, built for fun.
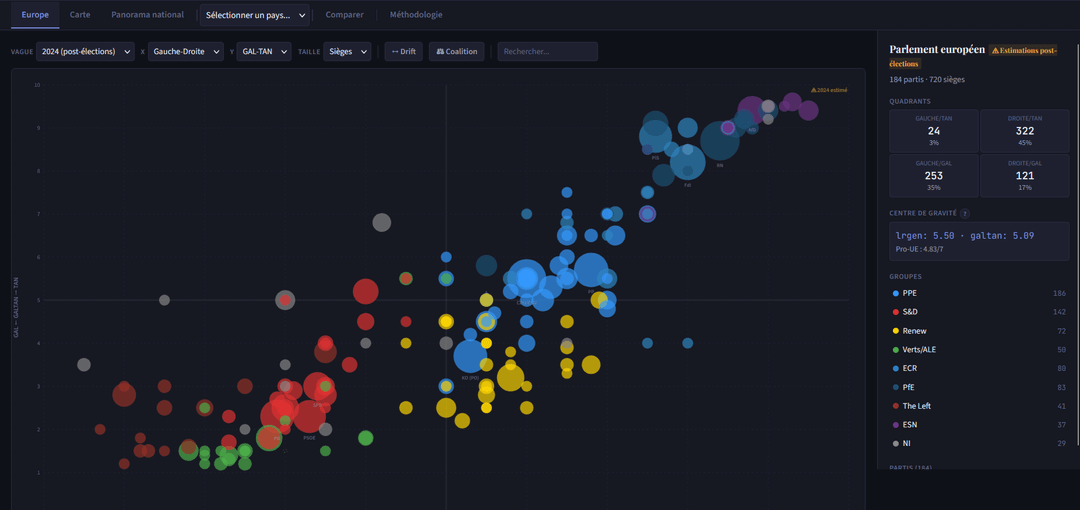
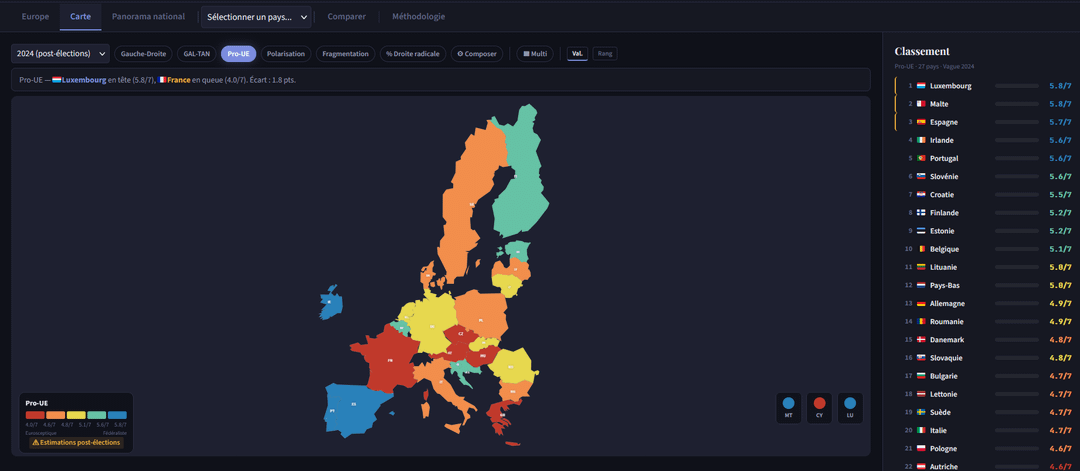
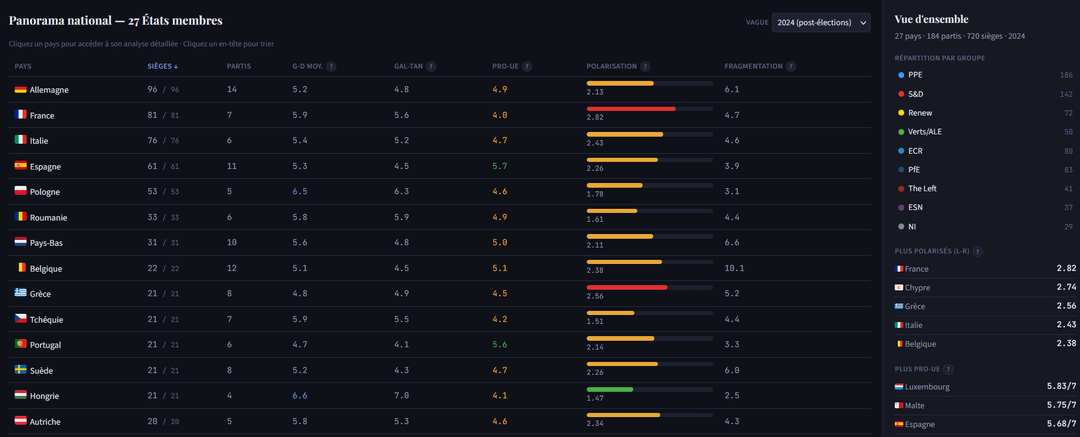
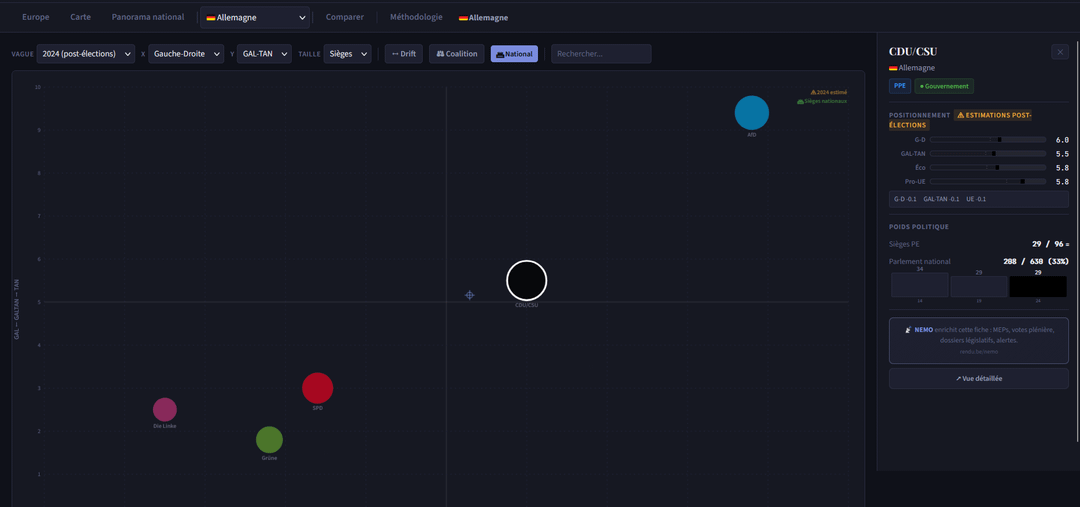
It plots 185 EU parties on ideological axes (CHES data : https://www.chesdata.eu/ches-europe), has a color-coded map of Europe with 6 metrics, a coalition simulator, country profiles with national seats and government status, ideological drift between 2014-2024, and a tool to build your own custom political index.
There's also a national view where you can explore each country's parties individually : their weight in parliament, their GAL-TAN positioning, how they've shifted over time (CHES + ParlGov : https://www.parlgov.org/ )
I'd like to push this further, but I'm running out of ideas, so I'd love to explore with you:
– What feature would make you actually bookmark this?
– What do you wish political data tools did that they don't?
– Would Council voting patterns, committee memberships, or legislative tracking interest you?
– Any country-specific data you can never find easily?
Thanks for your interest guys !
Note : sorry everything is in french atm bc this is my mother tongue, EN and DE are already planned
Pic 1 : European Parlement View
2 : Map view
3 : National stats view
4 : National graph view
Posted by ChanceGrapefruit4107
2 Comments
Datas about ideological axes (CHES data : [https://www.chesdata.eu/ches-europe](https://www.chesdata.eu/ches-europe))
ParlGov Project to find datas about EU and OECD democracies from 1900 to 2023 (ParlGov : [https://www.parlgov.org/](https://www.parlgov.org/) )
EU EP MEPs, groups and sieges : [https://results.elections.europa.eu/en/](https://results.elections.europa.eu/en/) & [https://www.europarl.europa.eu/meps/en/search/advanced](https://www.europarl.europa.eu/meps/en/search/advanced)
National Metrics Methodology (Pic 3) :
All metrics use CHES expert survey scores (0-10 scale, except Pro-EU which is 1-7) and are weighted by the number of seats each party holds.
**Avg. Left-Right**: weighted mean of each party’s general left-right position (CHES variable: lrgen), where weights are parliamentary seats. A low score means the parliament leans left overall, a high score means it leans right.
**GAL-TAN**: same logic, using the sociocultural axis. GAL (Green/Alternative/Libertarian) at 0, TAN (Traditional/Authoritarian/Nationalist) at 10. Captures the “values” dimension independently from economics.
**Pro-EU**: weighted mean of each party’s position on European integration (CHES variable: eu_position), on a 1-7 scale. 1 = strongly opposed, 7 = strongly in favor.
**Polarization**: weighted standard deviation of left-right scores.
Formula: σ = √( Σ(si × (xi – x̄)²) / Σsi )
where si = seats of party i, xi = L-R score of party i, x̄ = weighted mean.
A high value (>2.5) means the country is sharply divided between opposing blocs. A low value (<1.5) means relative consensus around the center.
**Fragmentation**: Effective Number of Parties, using the Laakso-Taagepera index (1979).
Formula: ENP = 1 / Σ(pi²)
where pi = seat share of party i.
If a country has 5 equally sized parties, ENP = 5. If one party holds 80% of seats, ENP is close to 1.5. It measures how dispersed political power is, regardless of the raw number of parties.
Am I missing something or did you not post a link to your political compass?