[OC] I analyzed 177,000 U.S. foundation tax filings (Form 990) – the top 1% of foundations control 71% of all charitable giving
Posted by Complex_Presence_949

![[OC] I analyzed 177,000 U.S. foundation tax filings (Form 990) - the top 1% of foundations control 71% of all charitable giving](https://www.byteseu.com/wp-content/uploads/2026/03/tscmq8xgu0rg1-1536x1333.png "[OC] I analyzed 177,000 U.S. foundation tax filings (Form 990) – the top 1% of foundations control 71% of all charitable giving")
[OC] I analyzed 177,000 U.S. foundation tax filings (Form 990) – the top 1% of foundations control 71% of all charitable giving
Posted by Complex_Presence_949
4 Comments
Data source: IRS Form 990 filings from 177,247 grantmaking foundations in the U.S., compiled from publicly available tax records.
Tools: Python (pandas for data processing, matplotlib for visualization), PostgreSQL for querying the dataset.
Some key findings that stood out:
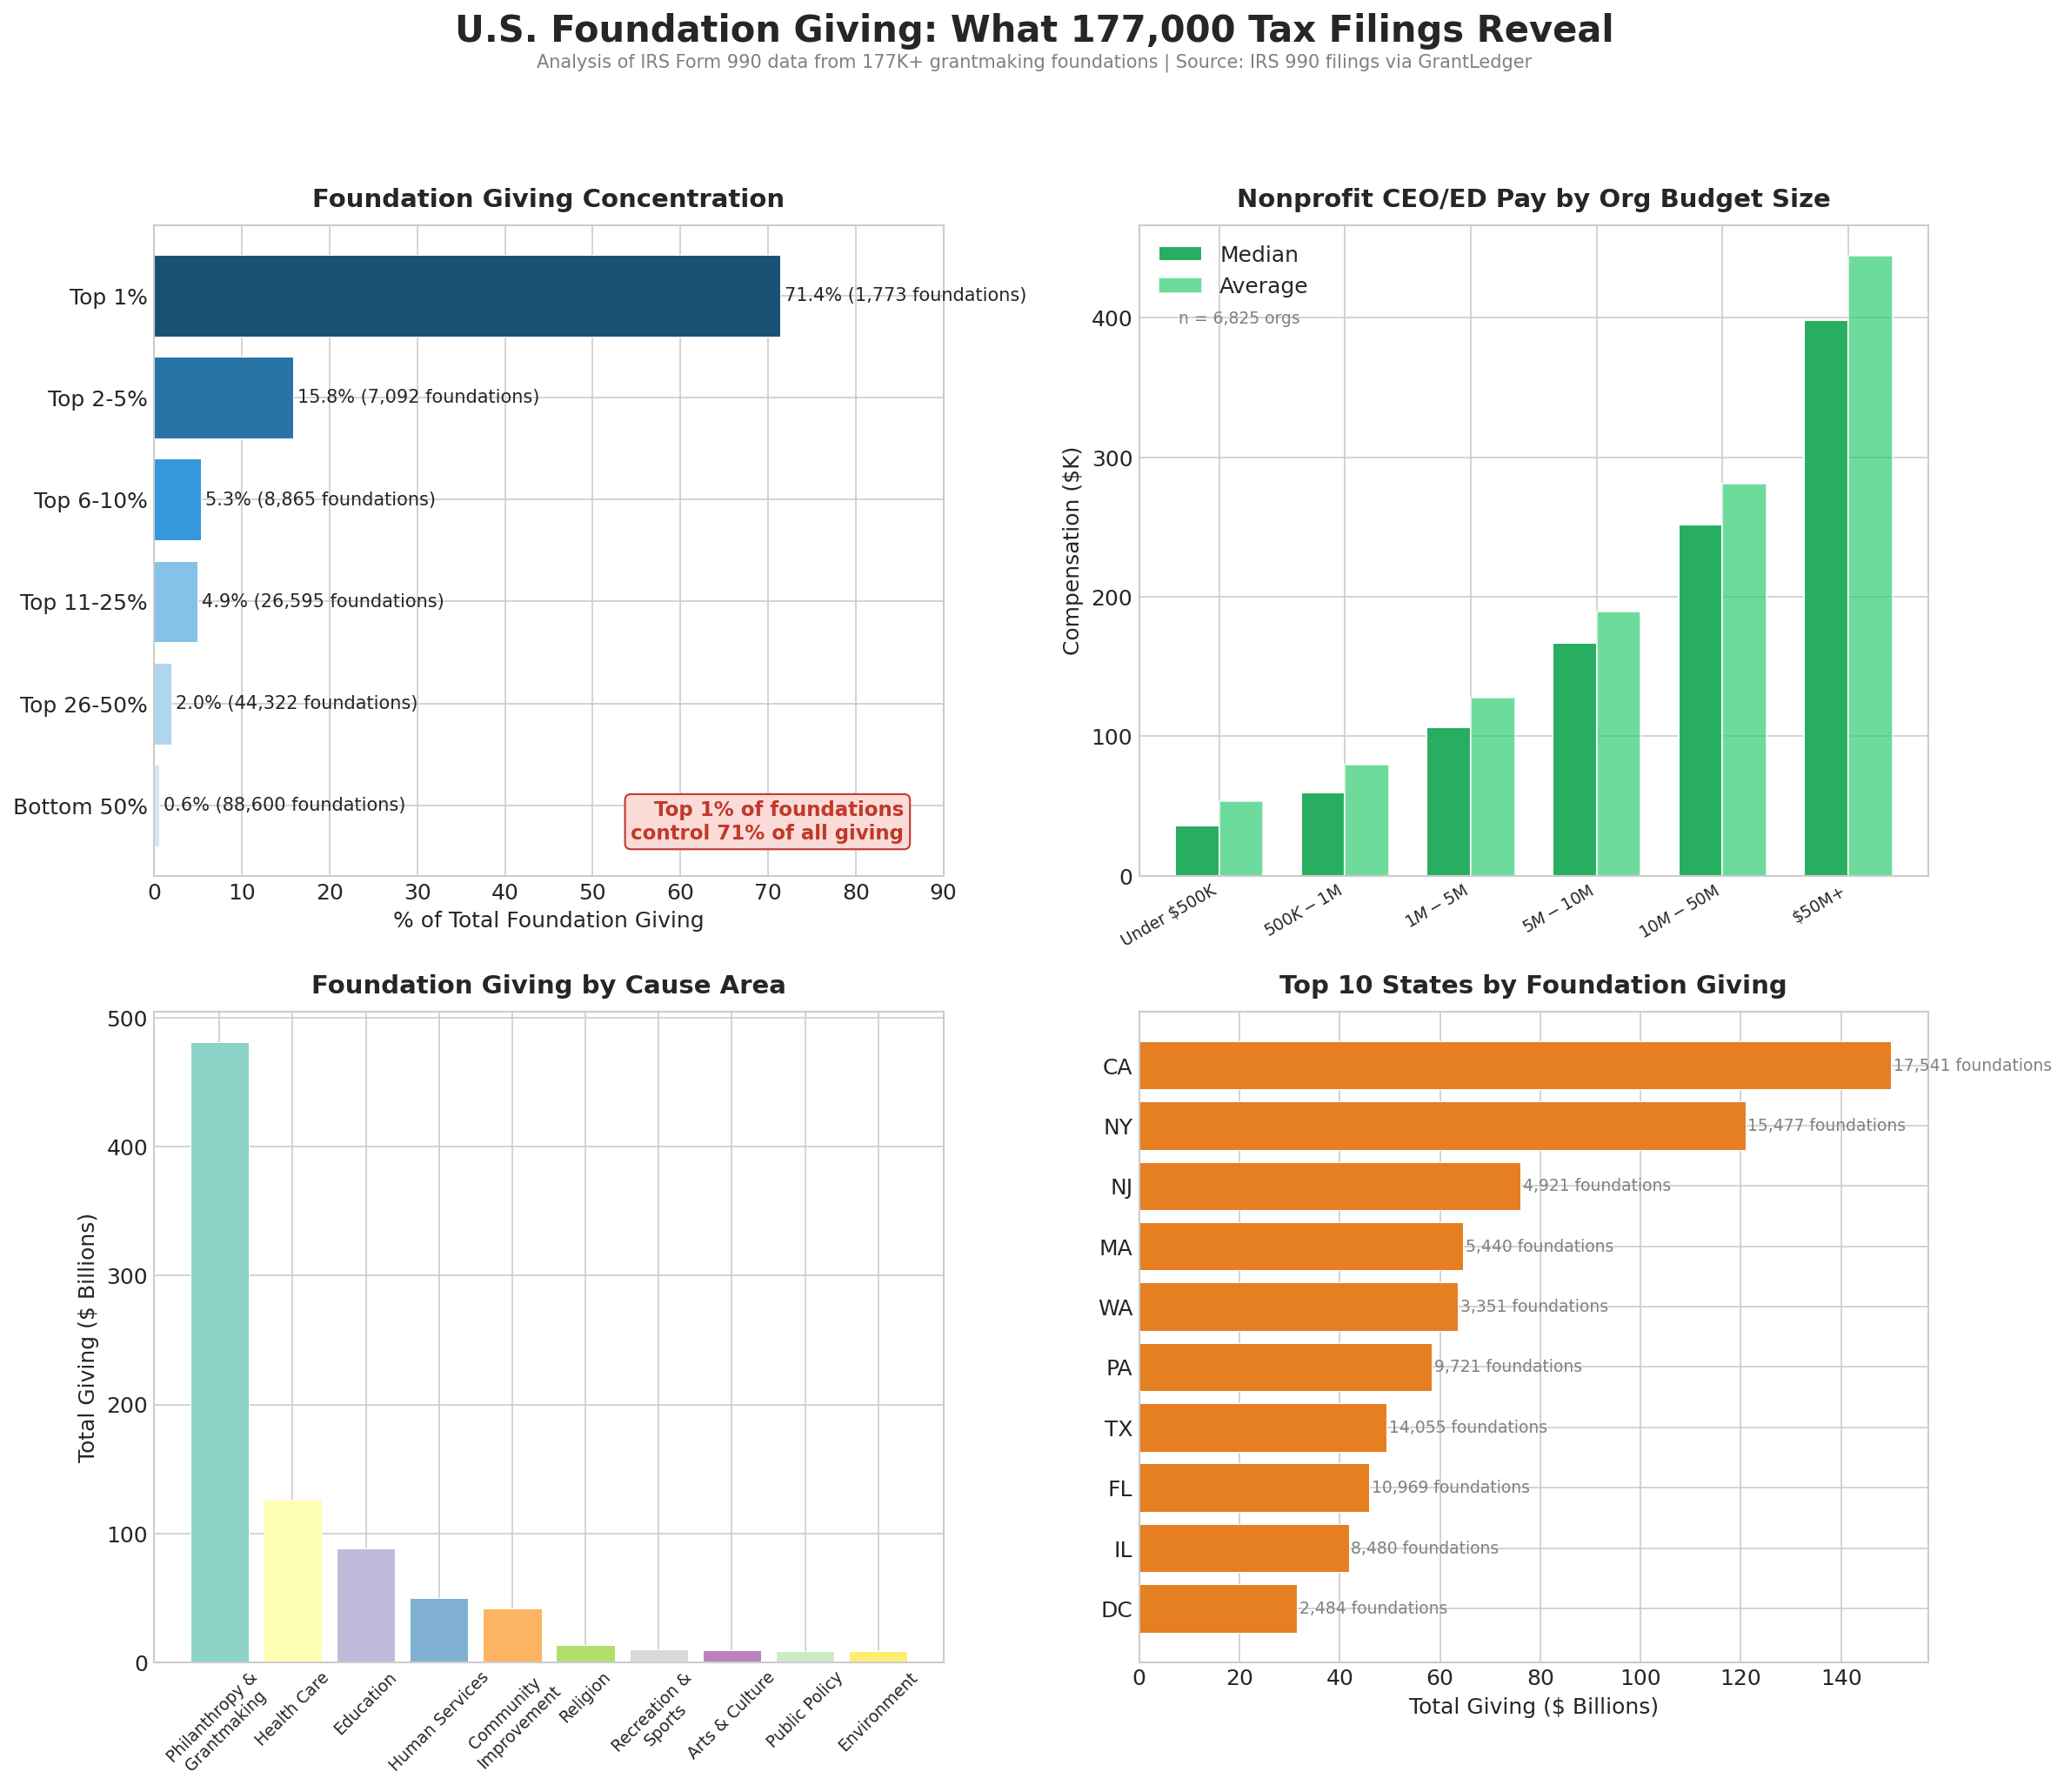
– The top 1% of foundations (just 1,773 organizations) control 71.4% of all charitable giving. The bottom 50% (88,600 foundations) account for only 0.6%.
– Nonprofit CEO/ED median pay ranges from $36K at orgs under $500K budget to $398K at $50M+ orgs. The gap between average and median grows significantly at larger orgs, suggesting a few very high earners pull the average up.
– “Philanthropy & Grantmaking” is the largest cause area by total giving ($481B), which makes sense since that includes community foundations and donor-advised funds that redistribute to other causes.
– California and New York dominate by total giving, but Washington state punches way above its weight relative to number of foundations (3,351 foundations, $63.5B in giving) — largely driven by the Gates Foundation and other tech-wealth philanthropy.
Happy to answer questions about the data or methodology.
This doesn’t surprise me. There are a lot of charities that operate at the hyperlocal level. I do not expect the independent food pantry I support for my small town of 22,000 to garner national support or attention.
What’s going on in the state data? TX seems to have tons of small foundations which in aggregate give less than PA, MA, WA, or NJ, even though there are 2-5x as many. I guess bigger geography results in more small local causes?
The disparity in that first chart is staggering—I didn’t expect the top 1% to control over 71% of the total giving. Really clean visualization too, the choice of colors makes it very easy to digest 177k data points. Great work OP!