

We selected 28 cities to represent a range of climate conditions across the United States. Following the city selection approach in9, climate regions were defined using data from the U.S. Office of Energy Efficiency and Renewable Energy’s Building America project22. Eight primary cities were highlighted in the main text as representative examples of distinct U.S. climate zones, including very cold, cold, mixed humid, hot humid, hot dry, and marine regions. The remaining cities were included to ensure regional diversity and adequate coverage for cross-city comparisons. We also prioritized locations with readily available time-of-use rate structures and accessible data from the American Housing Survey and the American Community Survey.
Across 28 representative U.S. cities, our results reveal that the combined impacts of heat pump adoption and climate change on household energy burdens are climate-dependent. In cold regions such as Buffalo and Boston, heat pump adoption increases winter burdens due to the replacement of low-cost natural gas with higher-cost electricity, but this effect is partially counterbalanced by future warming, which reduces heating demand and lowers seasonal burdens. In mixed-humid regions such as Baltimore and St. Louis, electrification and warming act in the same direction, amplifying burden reductions as heat pumps operate efficiently with warmer ambient temperatures. In hot and hot-humid regions such as Houston and Phoenix, heat pump adoption lowers burdens by improving cooling efficiency, yet future warming amplifies cooling demand, producing only modest net reductions. Marine climates such as Seattle and San Francisco show minimal overall change due to mild temperature variability and balanced seasonal demand. Our analysis highlights strong spatial heterogeneity: heat pump adoption and climate warming interact in ways that can either amplify or counterbalance each other, underscoring the importance of regional policy design tailored to local fuel prices, climate conditions, and baseline heating technologies.
Impact of Heating Electrification and Climate Change on Energy Burden: A Comparative Study of Detroit and Phoenix
While we analyze 28 cities (The code and data can be found in the public repository: https://github.com/yiminghit/Energ_Burden_Electrification (https://doi.org/10.5281/zenodo.17555298))., we begin by comparing the results for Detroit and Phoenix, as these are large cities that represent starkly different (cold and hot) climates. We analyze six scenario combinations of HVAC systems and climate conditions, summarized in Table 2, to isolate and compare the effects of electrification, climate change, and their interactions. We present the distribution of annual energy burdens, defined as the proportion of income spent on electricity and gas utility bills, for both cities for all six scenarios in Fig. 2. To understand how the most vulnerable households are affected, for each city, we separately present the results for the 10% of households that have the highest energy burdens in the current heating, historical climate (CHHW) scenario.
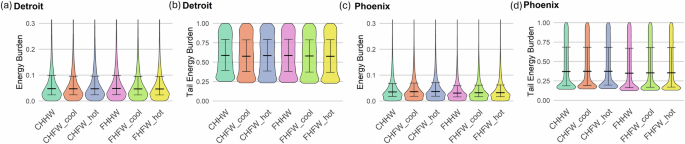
Comparison of annual energy burdens, defined as the proportion of income spent on utility bills, for a all sampled homes in Detroit, b top 10% of households with the highest burdens in Detroit, c all sampled homes in Phoenix, and d top 10% of households with the highest burdens in Phoenix for six scenario combinations of HVAC system and climate assumptions. The central horizontal line indicates the median, and whiskers denote the 5th and 95th percentiles. Scenario definitions: CHHW: Current HVAC with Historical Weather; CHFW_cool: Current HVAC with cooler RCP4.5 realization; CHFW_hot: Current HVAC with hotter RCP4.5 realization; FHHW: Future HVAC with Historical Weather; FHFW_cool: Future HVAC with cooler RCP4.5 realization; FHFW_hot: Future HVAC with hotter RCP4.5 realization.
Annual Energy Burdens
The energy burden in Detroit is much higher than that of Phoenix as homes in Detroit require a large amount of energy for both heating and cooling, while Phoenix’s energy needs are dominated by cooling. The hourly average ambient temperature in Detroit in the winter is -2°C23; so, to maintain an indoor temperature of 24 ∘C, for example, a heating system must work against a temperature differential of 26 ∘C. The average hourly ambient summer temperature in Phoenix is 34 ∘C; so a cooling system would need to overcome a temperature differential of only 10 ∘C on average.
The median energy burden in Detroit with current and future heating systems is 4.8%. In Phoenix, the energy burden is 3.5% with current systems and 3.1% (or 16% lower) with future systems, since heat pumps–acting as air conditioners in the summer–provide more efficient cooling than currently-installed air conditioning systems. Furthermore, the use of these future systems produces a narrower spread in energy burden in Phoenix but not in Detroit. The 90th percentile range of energy burdens in Detroit is 58% with current and future heating systems. In Phoenix, the 90th percentile range of energy burdens is 37% with current heating systems and 35% for future systems.
Figure 2 shows that, in Detroit, the 10% of households with the highest energy burden have a median annual energy burden of 58%, which is 12 times the already-high annual energy burden of nearly 5% for all homes. These burdens remain persistently high in all scenarios. In Phoenix, the annual median energy burden for all modeled homes is 3.5% (5th to 95th percentile range: 0.36–37%); for the 10% of homes with the highest burdens it is 37%.
Monthly Energy Burdens
Our finding that a switch to electric heat pumps only slightly increases energy burdens in Detroit appears at first glance to be inconsistent with past findings that a switch from natural gas heating to electric heating raises energy costs in cold climates in the U.S9. However, other studies have shown that a shift from resistance electric heating, propane, or fuel oil cuts bills and burdens even in cold climates24. Our study (Fig. 3) shows that the savings from the latter are so large that, when aggregated with the losses from the former, they could produce an overall reduction in energy burdens even for cities such as Detroit, which are cold and for which natural gas heating dominates. Decision-makers should however, be careful about aggregating such observations across households as well as across the months of the year. In the coldest months, the aggregate effect of total heating electrification is to raise the energy burden. In January, the median energy burden of households with natural gas is 7.7% (0.83–65%), which increases to 9.5% (0.10–69%) with electrified heating systems. A two percentage-point change in energy burdens is large: the median energy burden in the U.S. is 3%21; so a 2 percentage point increase represents a near-doubling of what an average household spends on energy. Put differently, the Federal poverty line for the continental United States is $25,820. A 2 percentage point increase in energy burdens translates to $500 in additional energy costs every year for a poor household. For households with heating systems using propane and oil, the median energy burden is 3.7% (0.38–46%) and would decrease to 3.3% (0.31–48%) with future electrified systems. In contrast, current heating systems using electricity with resistive heating have a median energy burden of 19% (0.23–93%), which reduces to 11% (1.2–75%) with future electrified systems.
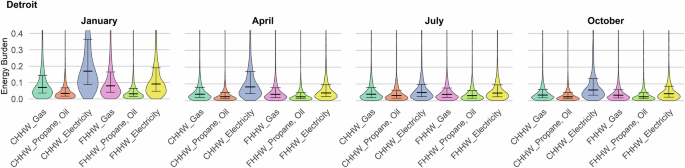
The winter energy burdens for homes that use resistive electric heating (CHHW_Electricity) are high; these burdens are sharply reduced by a shift to electric heat pumps (FHHW_Electricity). The central horizontal line indicates the median, and whiskers denote the 5th and 95th percentiles. Scenario definitions: CHHW: Current HVAC with Historical Weather; FHHW: Future HVAC with Historical Weather.
This reinforces the need to target both subsidies and advice: a switch to heat pumps produces big benefits for those who use resistive heating and smaller benefits for those who use propane or fuel oil. While our analysis focuses on energy burdens, switching to heat pumps may bring co-benefits such as improved indoor air quality from the elimination of natural gas, which are not examined in this study. Subsidies that reduce upfront cost are most likely to induce these households to switch to heat pumps. For households using natural gas, one-off subsidies are unlikely to compensate for the lifetime of higher bills. Therefore, such subsidies may only be taken up by those who are sufficiently well off to accept higher bills. Overall for IRA subsidies, the evidence so far suggests that this is already happening25.
Figure 4 shows that in Detroit, the energy burden is highest in January. A warmer climate could alleviate the energy burden during the colder months by reducing heating demand. In Phoenix, the energy burden rises in the summer with a warmer climate. Warmer future climates induce a substantial increase in energy burden.
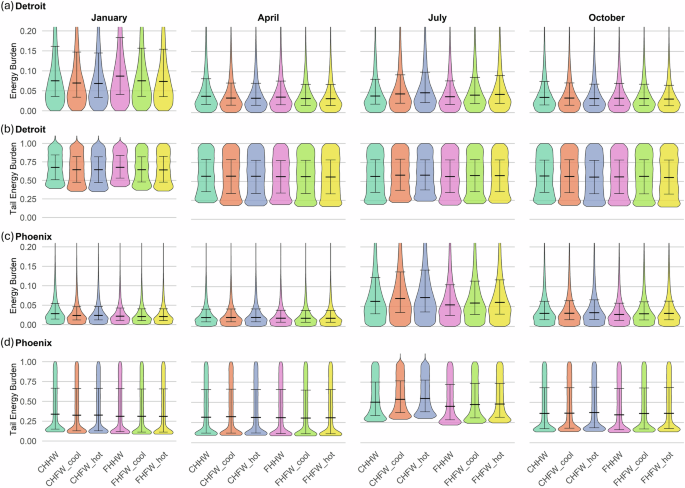
Distributions of monthly energy burdens in January (winter), April (shoulder season), July (summer), and October (shoulder season) for (a) all modeled households in Detroit, (b) for the 10% of Detroit households with the highest energy burdens, (c) all modeled households in Phoenix, and (d) for the 10% of households with the highest energy burdens in Phoenix. The central horizontal line indicates the median, and whiskers denote the 5th and 95th percentiles. Scenario definitions: CHHW: Current HVAC with Historical Weather; CHFW_cool: Current HVAC with cooler RCP4.5 realization; CHFW_hot: Current HVAC with hotter RCP4.5 realization; FHHW: Future HVAC with Historical Weather; FHFW_cool: Future HVAC with cooler RCP4.5 realization; FHFW_hot: Future HVAC with hotter RCP4.5 realization.
In Detroit, electrification raises the energy burden in January because the ratio of electricity to gas prices exceeds the coefficient of performance of cold climate heat pumps in the winter. In Phoenix, a switch to heat pumps–which we assume will be more efficient than existing air conditioners–consistently lowers energy burdens throughout the year, with the largest impact occurring during summer. In January, the coldest month of the year, switching to electric heat pumps increases energy burdens in Detroit. Under the current climate, the median energy burden of the current heating system is 7.5% (0.74%–67%). This increases to 8.7% (0.83%–69%) with the adoption of electric heat pumps. A warmer climate eliminates this effect, reducing the median burden for all households to levels similar to those before the switch to electric heating. Under the cool realization of RCP 4.5 scenario, with electrified heating, the median energy burden is 7.5% (0.76%–64%), while under the hot realization scenario, it is 7.3% (0.34%–64%). For the 10% of households with the highest energy burdens, switching to electric heating the median energy burden rises slightly from 67% (41%–98%) to 69% (41%–97%).
However, with current heating systems, a warmer climate reduces heating burdens during the coldest months. The median energy burden under the cool realization scenario decreases from 7.5% (0.74–67%) to 7.0% (0.69–64%), while under the hot realization scenario, it decreases further to 6.9% (0.71–64%). Importantly, for some of the households with the highest energy burdens, energy costs in January currently exceed income. A warming climate, along with heat pump adoption, eliminates this effect. Only 0.14% of all households exhibit January energy burdens exceeding 100% of income with the current climate. These households earn less than $15,000 annually and typically spend $1,250–$2,500 on energy during January. Nearly all (97.4%) rely on electric heating, with the rest using natural gas. Following heat pump adoption with the current climate, the share of households with energy burdens above 100% declines to 0.0036%. With heat pump adoption and a cooler climate, no households experience monthly energy costs that exceed income.
Similarly, while a warmer climate slightly increases energy burdens in Detroit during the summer, this effect is partially offset by the more efficient cooling assumed for heat pumps. The median energy burden rises from 4.1% (0.43–57%) under the current climate with current HVAC to 4.9% (0.51–58%) under a hot climate with current HVAC. However, when future HVAC systems are adopted under the same hot climate, the burden decreases to 4.5% (0.49–58%).
In Phoenix, with the historical climate and the efficiency of current air conditioners, the median energy burden in July is 6.3% (0.64–50%), rising to to 7.3% (0.73–55%) under the hot realization. Under the historical climate, the median energy burden with more efficient air conditioning is 5.43% (0.56–45%). With the hot realization of the RCP 4.5 scenario and more efficient air conditioning, the median energy burden is reduced 6.1% (0.62–48%), similar to the energy burden with the current climate and current air conditioner efficiency.
For the 10% of Phoenix homes with the highest energy burdens, with current air conditioners, the median extreme energy burden increases from 50% (27–95%) to 54% (30–96%) under the cooler realization and to 55% (31–96%) under the hotter realization. With more efficient heat pumps providing air conditioning, the energy burden for this subset of homes is 48% (26–95%) under the hot realization, lower than the burden observed with the historical climate and current air conditioner efficiency.
Impact of Heating Electrification and Climate Scenarios on Energy Burdens: Case Study for Cities Across Different Climate Zones
The monthly energy burden across diverse cities reveals a complex interplay between heating electrification, climate change, and regional variations in electricity, gas, propane, and oil prices. Here, we explore these complex interactions for six cities, examining how heating electrification, climate change, and local energy prices shape monthly energy burdens (Fig. 5).
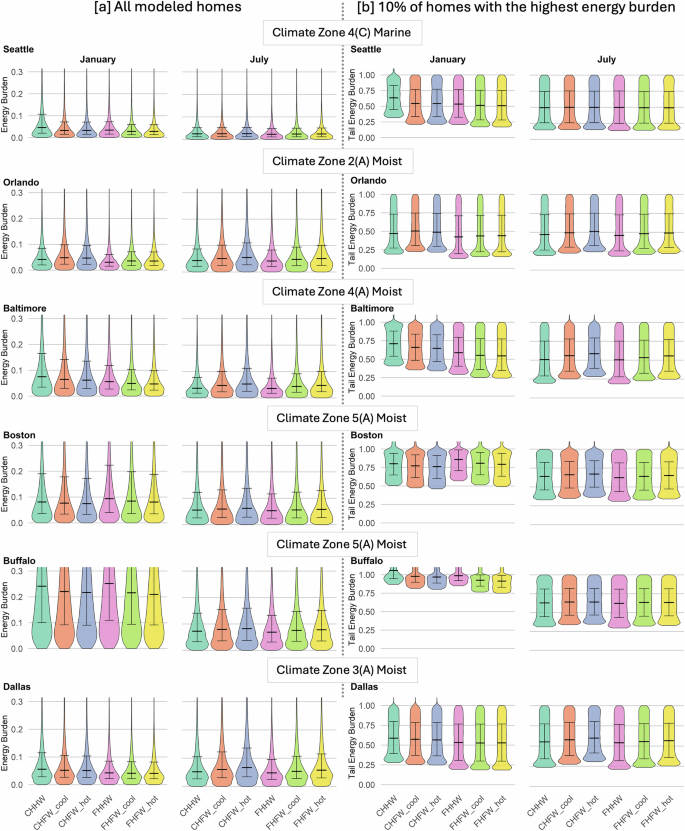
Distribution of monthly energy burdens for select cities in different IECC Climate Zones as defined in42 for (a) all modeled homes and (b) 10% of homes with the highest energy burdens in select U.S. cities in January and July. In each column, we present the distribution of energy burdens for (left) January and (right) July. The central horizontal line indicates the median, and whiskers denote the 5th and 95th percentiles. Scenario definitions: CHHW: Current HVAC with Historical Weather; CHFW_cool: Current HVAC with Future Cooler Weather; CHFW_hot: Current HVAC with Future Hotter Weather; FHHW: Future HVAC with Historical Weather; FHFW_cool: Future HVAC with Future Cooler Weather; FHFW_hot: Future HVAC with Future Hotter Weather.
Our results show extraordinarily high energy burdens in cities such as Buffalo, which has a combination of extremely cold winters and low income. This finding is consistent with other observations: a study by the State University of New York Buffalo finds an annual energy burden of 9% in Erie County, New York, with one census track showing annual energy burdens as high as 18%26. By comparison, we find an annual energy burden of 12.6% (5.9–29.9%) in Buffalo. We show that, in January, the median energy burden across all households in Buffalo is 23.9% (10.9–55.0%). Compared with other cities, Buffalo experiences exceptionally high winter energy burdens, roughly four to five times higher than those in Seattle and about three times higher than those in Baltimore or Dallas. Warming alone would reduce this burden to 21.4% (9.7–49.1%); a switch to electric heat pumps alone would increase the burdens to 25.0% (11.8–54.2%). A combination of warming and a switch to electric heat pumps would keep the burdens at 20.8% (9.8–45.2%).
Heating electrification with efficient heat pumps reduces energy burdens in all cities with milder winters, particularly for households experiencing high energy burdens.
Baltimore and Dallas both experience warm summers and moderately cold winters. In Baltimore, during January with the historical climate, the median energy burden decreases from 7.6% (0.69–73%) with the current heating system to 5.5% (0.53–59%) when using electric heat pumps, a fall of over 2 percentage points. The burden falls slightly further to 5.1% (0.49–57%) for the hot realization of RCP4.5. In comparison, with the current heating system, the energy burden falls 1.3 percentage points to 6.3% (0.6–65%) for the hotter realization of RCP4.5. In Dallas, in January with the historical climate, the median energy burden decreases from 7% (0.75–63%) with the current heating system to 4.9% (0.54–55%) with electric heat pumps. For the current heating system, the energy burden decreases to 6.4% (0.7–61%) for the hot RCP4.5 realization. However, with electrified heating systems, the energy burden is only slightly affected, remaining at 4.9% (0.54–55%) for the hotter RCP4.5 realization. A switch to heat pumps reduces energy burdens in Baltimore and Dallas primarily because moderate winter temperatures mean that the effective coefficient of performance (COP) during the winter, and the greater cooling efficiency during the winter, are together sufficient to overcome the fact that, per unit energy, electricity is more expensive than gas. This electricity-to-gas price ratio is also lower in these cities than colder, northern cities.
Although Seattle, Detroit, and Boston are at similar latitudes, Seattle has a milder, wetter climate. The average winter temperature in Seattle is around 6 ∘C, which is higher than in Detroit or Boston, enabling households in Seattle to meet heating demands with lower energy consumption. Electrification, therefore, yields notable energy savings in Seattle due to high COPs and low electricity prices. In January, the median energy burden decreases from 4.6% (0.41–64%) with the current HVAC system to 3.4% (0.32–54%) after electrification.
Orlando experiences a large cooling demand even during the winter months. In January, the median energy burden with the current HVAC system increases from 5.9% (0.60–54%) to 6.5% (0.63–58%) under the hot RCP4.5 realization. If more efficient heat pumps are used to provide cooling, the median energy burden increases from 3.6% (0.37–44%) with the historical climate to 4.2% (0.44–46%) with the hot realization. Orlando’s energy use is dominated by cooling needs. The energy burden increases when moving from the current historical (CHHW) to the future (CHFW) climate due to the latter’s higher cooling demand. Although switching to more efficient heat pumps (FHFW) reduces the burden relative to CHFW, the total burden remains higher than in CHHW.
National Energy Burden Trends by Climate Zone
Figure 6 shows how the distribution of energy burdens varies by climate zone (each of the cities in these figures belongs to a different climate zone), season, current or future HVAC system, and historical and projected climate. The energy burden statistics for the median, fifth percentile, and ninety-fifth percentile are presented in Tables A3 through A6 in the Supplementary Information. The changes in energy bills under different climate conditions and current/future HVAC systems are provided in Tables A7 and A8. We plot the distribution of energy burdens for 19 additional cities in Figs. 7, 8, and 9. The apparent similarity of the violin plots arises partly from a visualization trade-off between emphasizing differences in mean values and capturing the full range of outcomes. Our figures are designed to show the complete energy burden distribution, including its spread and skewness, to highlight inequality and variability across households. This broader representation can visually mask small mean differences between modeling approaches; zooming in on the central region would make these mean shifts more apparent but would obscure the overall distributional changes that are key to understanding energy burden disparities. Beyond visualization, the similarity also reflects structural consistency in the underlying systems. RC-BEM framework is physics-based and rely on comparable thermodynamic principles, leading to convergence in heating and cooling demand predictions. Additionally, income distributions, housing characteristics, and fuel price ratios across U.S. cities share similar patterns, producing distributions with comparable shapes even when their mean energy burdens differ.
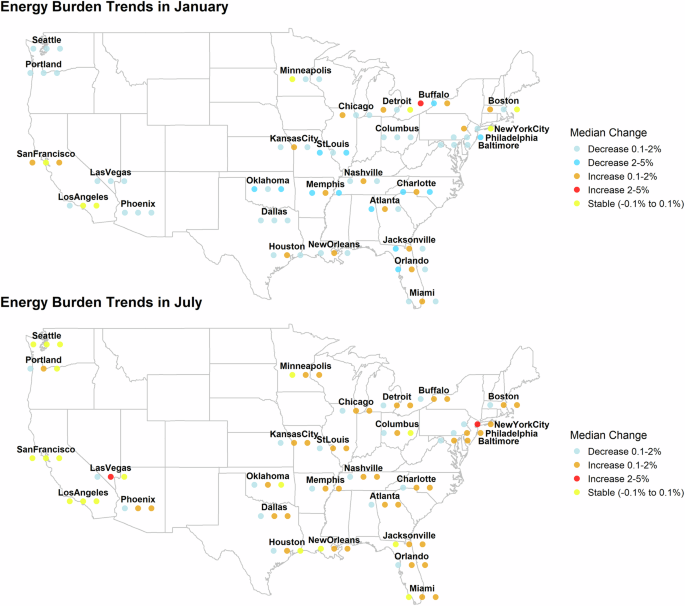
The leftmost dot represents the median percentage point change in energy burden associated with a shift from current to future, electrified heating, given the historical climate. The middle dot represents the change in burden associated with a shift from the current to the future, RCP4.5_hot, climate assuming that the heating system stays unchanged. The rightmost dot represents a change from the historical climate and current heating system, to the RCP4.5_hot climate and future heating system. Produced by authors using the maps open source package in R.
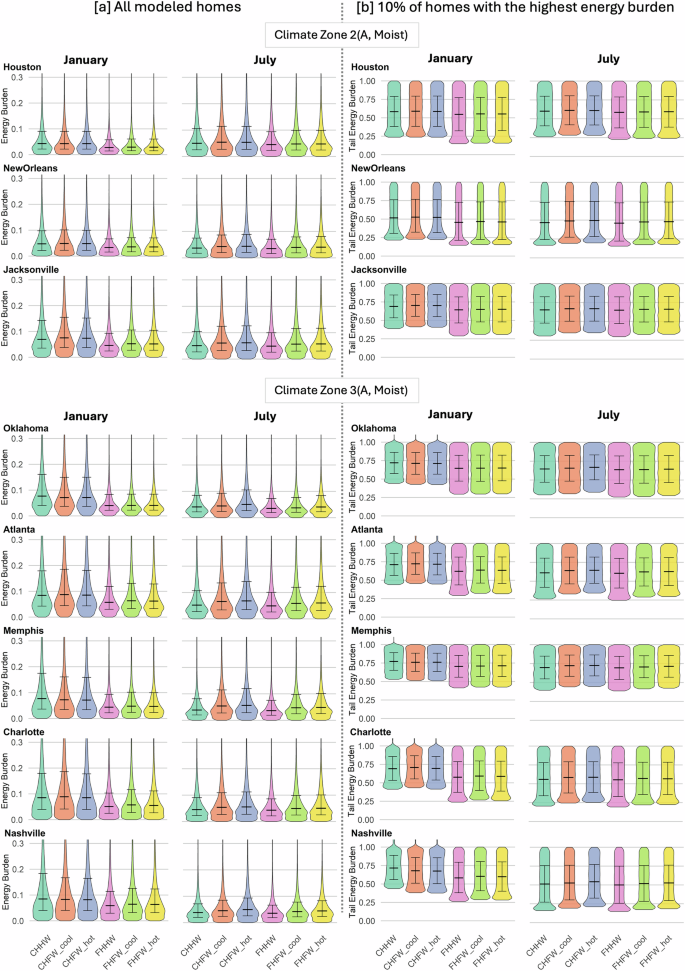
Distribution of monthly energy burdens for IECC Climate Zones 2A and 3A, as defined in42 for (a) all modeled homes and (b) 10% of homes with the highest energy burdens in select U.S. cities in January and July. In each column, we present the distribution of energy burdens for (left) January and (right) July. The central horizontal line indicates the median, and whiskers denote the 5th and 95th percentiles. Scenario definitions: CHHW: Current HVAC with Historical Weather; CHFW_cool: Current HVAC with Future Cooler Weather; CHFW_hot: Current HVAC with Future Hotter Weather; FHHW: Future HVAC with Historical Weather; FHFW_cool: Future HVAC with Future Cooler Weather; FHFW_hot: Future HVAC with Future Hotter Weather.
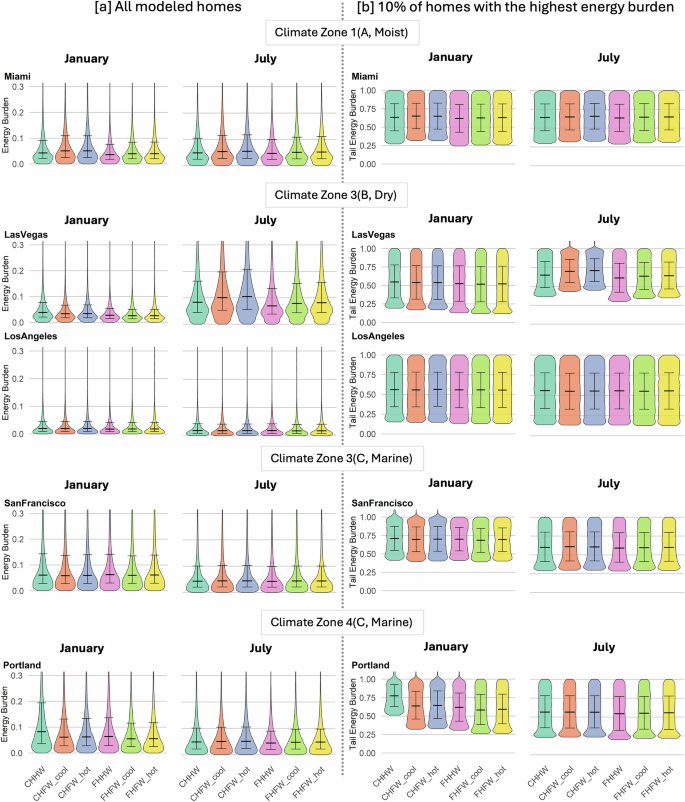
Distribution of monthly energy burdens for IECC Climate Zones 1A, 3B, 3C, and 4C as defined in42 for (a) all modeled homes and (b) 10% of homes with the highest energy burdens in select U.S. cities in January and July. In each column, we present the distribution of energy burdens for (left) January and (right) July. The central horizontal line indicates the median, and whiskers denote the 5th and 95th percentiles. Scenario definitions: CHHW: Current HVAC with Historical Weather; CHFW_cool: Current HVAC with Future Cooler Weather; CHFW_hot: Current HVAC with Future Hotter Weather; FHHW: Future HVAC with Historical Weather; FHFW_cool: Future HVAC with Future Cooler Weather; FHFW_hot: Future HVAC with Future Hotter Weather.
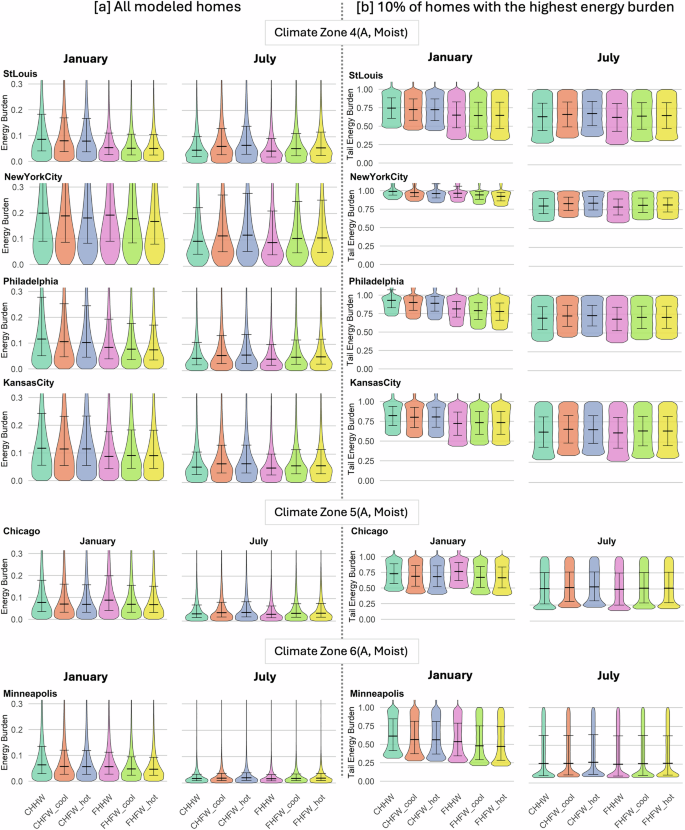
Distribution of monthly energy burdens for IECC Climate Zones 4A, 5A, and as defined in42 for (a) all modeled homes and (b) 10% of homes with the highest energy burdens in select U.S. cities in January and July. In each column, we present the distribution of energy burdens for (left) January and (right) July. The central horizontal line indicates the median, and whiskers denote the 5th and 95th percentiles. Scenario definitions: CHHW: Current HVAC with Historical Weather; CHFW_cool: Current HVAC with Future Cooler Weather; CHFW_hot: Current HVAC with Future Hotter Weather; FHHW: Future HVAC with Historical Weather; FHFW_cool: Future HVAC with Future Cooler Weather; FHFW_hot: Future HVAC with Future Hotter Weather.
In Fig. 6 the impact of heat pump adoption (leftmost dot), climate change (middle dot), and their combined effects (rightmost dot) on energy burden across five U.S. climate zones: hot-humid, hot-dry/mixed-dry, mixed-humid, marine, and cold/very cold. The results highlight regional disparities in electrification benefits, influenced by seasonal energy demands, fuel costs, and climate shifts. During the winter, electrification alone is likely to increase the energy burden in cities in the Northeast, but a combination electrification and climate change is projected to increase the median energy burden in only in Buffalo and San Francisco. A warming climate will likely increase burdens everywhere, although this effect will be ameliorated by the higher efficiency of heat pumps operating as air conditioners in cities that are already hot.
In hot-humid regions (e.g., Houston, Miami, Atlanta), heat pump adoption reduces energy burden in both summer and winter by improving cooling efficiency and replacing higher-cost electric resistance heating. Projected future climates increase cooling demand, leading to slightly higher summer and winter energy costs. The combined effect during winter remains a net burden reduction.
In hot-dry and mixed-dry regions (e.g., Phoenix, Las Vegas), results are mixed. Most areas maintain stable burdens, but Phoenix may experience higher cooling costs due to extreme summer temperatures. A switch to efficient heat pumps for air conditioning lower burdens; however, future warming increases burdens. Phoenix’s summer energy burden is lower than Las Vegas’s because Phoenix households have higher incomes, which reduces the burden denominator, and because Phoenix’s TOU peak electricity rate is substantially lower than Las Vegas’, while off-peak rates are similar. The combination of higher income and lower peak pricing lowers Phoenix’s July energy burden relative to Las Vegas, despite broadly similar cooling loads.
In mixed-humid regions (e.g., St. Louis, Kansas City), heat pump adoption reduces energy burden as these systems improve cooling efficiency and moderate heating costs. Future climate conditions slightly increase summer burdens and decrease winter burdens. A combination of electrification and warming would reduce burdens.
In marine climates (e.g., San Francisco, Seattle, Portland), energy burdens remain relatively stable across future climate and HVAC scenarios. Heat pump adoption generally lowers burdens in winter, with Seattle and Portland seeing slight reductions. San Francisco, however, experiences a modest winter increase, likely due to higher electricity use for heating. Climate change has minimal impact on summer energy burdens in San Francisco and Seattle, consistent with their already mild summer conditions. Portland, however, exhibits a modest increase in summer burden, showing a potential sensitivity to warmer weather and increased cooling demand. The net effect of electrification and climate change in the Pacific Northwest remains limited, with energy burdens stable or marginally affected. Portland exhibits higher energy burdens than Seattle, largely due to income and electricity cost differences. Portland has lower average household incomes and a larger proportion of low-income residents, causing energy expenses to represent a greater share of income. In contrast, Seattle benefits from lower electricity rates, which help keep energy burdens lower despite similar climate conditions.
In cold and very cold regions (e.g., Boston, Chicago, Minneapolis), electrification often increases winter energy burdens due to the replacement of lower-cost fossil fuels with higher-cost electricity for space heating. However, winter warming under future climate scenarios reduces heating demand, which can partially or fully offset these increases. For instance, in Chicago, electrification alone leads to a noticeable rise in winter burden, but this effect is counterbalanced by projected climate warming, and the combined effect of electrification and climate change results in a net burden decrease. By contrast, cities such as Buffalo continue to experience an increase in winter burden even under warming projections. These findings underscore the spatial heterogeneity in outcomes and suggest that the economic feasibility of residential electrification in colder regions will depend on local energy prices, fuel mix, and the magnitude of climate change impacts.
Taken together, these results reveal that the effects of electrification and climate change on household energy burdens are deeply shaped by regional context. In very cold and cold climates (e.g., Buffalo, Chicago), electrification alone can increase winter burdens due to higher electricity prices and reduced heating efficiency at low temperatures, but partial offsets arise under warmer future climates. In mixed-humid regions (e.g., Baltimore, Atlanta), moderate winters and lower electricity-to-gas price ratios make electrification beneficial in both winter and summer. Hot-humid and hot-dry regions (e.g., Dallas, Phoenix) experience modest net effects as higher cooling demand is balanced by the high efficiency of modern heat pumps. Marine climates (e.g., Seattle) show minimal variation owing to mild temperature swings.