Source: Salary data from Levels.fyi, a compensation transparency site. Tax rates sourced from the IRS (federal brackets) and individual state/local tax authorities (2025 rates).
Tools: Python (Matplotlib)
Methodology: For each metro area, I pulled the median total compensation (base + stock + bonus) for software engineers. I then calculated after-tax take-home by applying 2025 federal income tax brackets, state income tax rates, and FICA (Social Security + Medicare) to each metro’s median TC. The breakdown on the right side of the chart shows the effective rate for each component.
Large-Investment-381 on
Very interesting, thank you.
I’d like to have the after-tax percentage (take-home pay) in addition to dollar amounts.
Why is FICA and federal tax percentages different? I would assume they would stay the same b/c we all pay the same? (hopefully, lol)
tmanXX on
Cool info. Seriously!
In this case though, Washington does not have state income tax, so of course they will take home more.
Yes, SF and Seattle have higher income, but they’re also much higher cost of living compared with some of the other cities.
123DCP on
I could be wrong, but I think this significantly overstates the impact of taxation for most people. Income and taxable income can be very different. Even if you know taxable income, credits can reduce taxation below the total calculated base on taxable income.
Money used for pretax retirement savings (401(k)s, IRAs, etc.) is not taxed. Having kids reduces taxes. Active efforts at legally reducing taxes can work.
phdoofus on
So when you say TC I’m assuming you mean not just bonuses but also vested RSUs where you take the tax up front, right?
AnalyticalAlpaca on
Somewhat interesting, but ignores cost of living in the different places.
Solmors on
Interesting chart. But just so people know, [levels.fyi](http://levels.fyi) is mostly for FAANG companies so the salaries are skewed higher, pay from smaller companies is lower than this.
Reminds me of the first site I built during my bootcamp. I got the Cost of Living Index from the 110 largest cities in the US, and would then scrape glassdoor for a users searched job title and compare the salary vs the Cost of Living to create a “relative pay”.
Hawaii was always lowest because it CoL was so high and pay pretty low, Austin was usually high because the pay was pretty good and CoL quite low. This was in 2017 but looking at your graph it seems like not much changed.
Edit: my site is down now unfortunately, glassdoor changed their URL structure so my scraper broke as well as my database service ending their free postgres option.
ggtffhhhjhg on
Every tax in CA is higher than MA. There’s no way someone in LA with the same salary takes home more. I also don’t believe the salaries in Portland and San Diego being higher than LA and Boston.
tyen0 on
NYC doesn’t have the NYC tax also deducted on top of federal and state? or just didn’t fit in the description nicely?
reddit_xeno on
At least one FAANG has NY in top pay bracket (along with Bay and Seattle) compared to LA, so doesn’t seem too accuratex
Spiritual-Fix3381 on
Somewhat interesting, but ignores cost of living in the different places…
QuiEgo on
This is interesting, although it does not paint the total picture. Ex cost of gas and electric in CA, or (much) higher property taxes in Texas.
twelvydubs on
NYC is missing the addition 3.8% city tax
4xi0m4 on
Great point on Seattle. The lack of state income tax combined with relatively moderate COL compared to SF/NYC makes it pretty attractive. The levels.fyi data shows Seattle consistently in the top 3 for TC but the take-home math really does make it one of the best overall values for SWEs.
InGod_WeThrust on
I’d really like to see the effects of the taxes with the same salaries and the average cost of living impacting them.

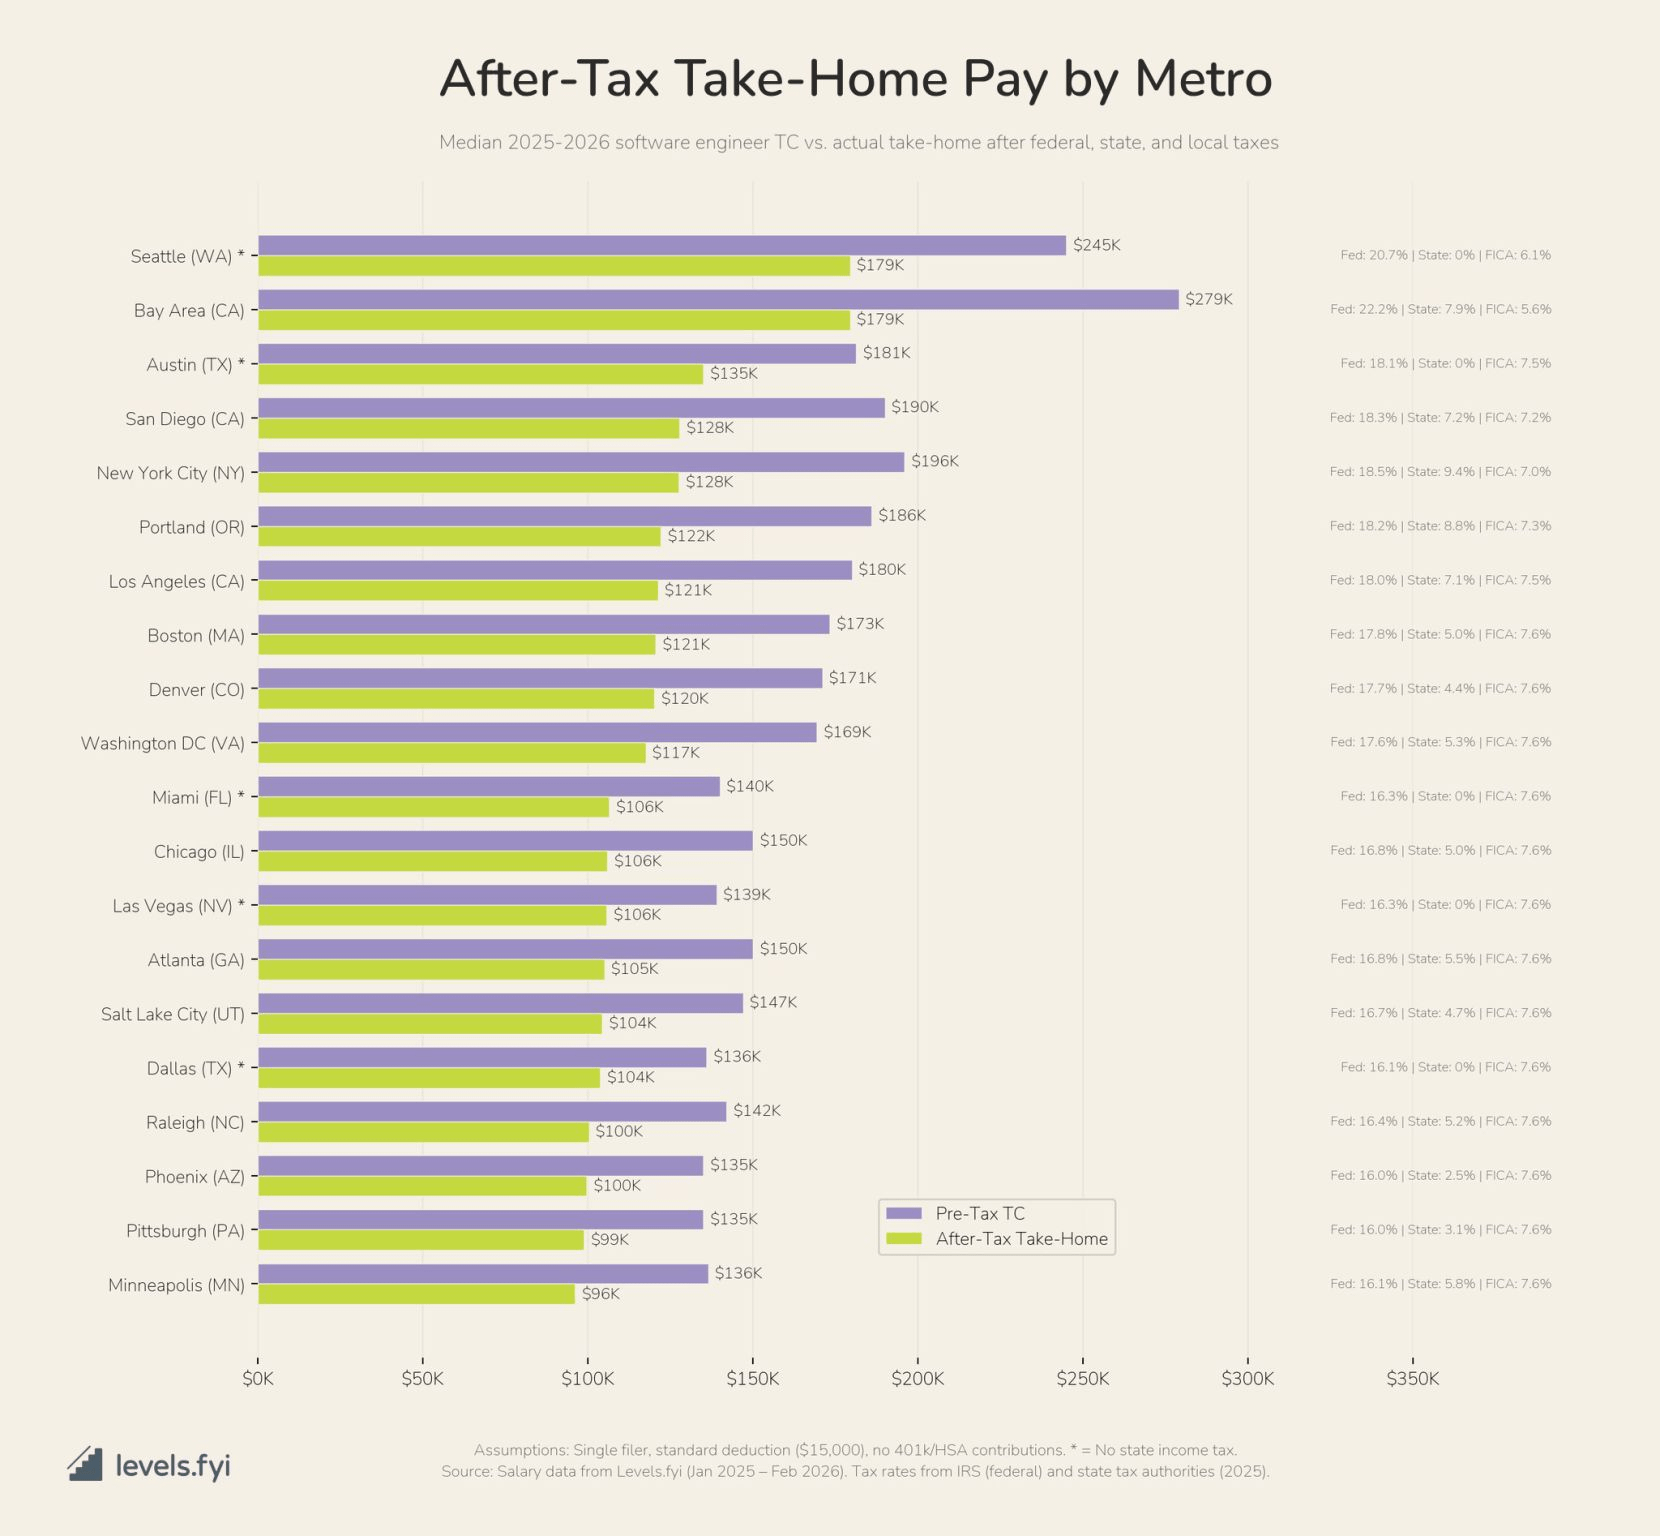
![[OC] Software Engineer After-Tax Take-Home Pay by US Metro](https://www.byteseu.com/wp-content/uploads/2026/03/or3cfmfr88rg1-1536x1421.png "[OC] Software Engineer After-Tax Take-Home Pay by US Metro")
16 Comments
Source: Salary data from Levels.fyi, a compensation transparency site. Tax rates sourced from the IRS (federal brackets) and individual state/local tax authorities (2025 rates).
Tools: Python (Matplotlib)
Methodology: For each metro area, I pulled the median total compensation (base + stock + bonus) for software engineers. I then calculated after-tax take-home by applying 2025 federal income tax brackets, state income tax rates, and FICA (Social Security + Medicare) to each metro’s median TC. The breakdown on the right side of the chart shows the effective rate for each component.
Very interesting, thank you.
I’d like to have the after-tax percentage (take-home pay) in addition to dollar amounts.
Why is FICA and federal tax percentages different? I would assume they would stay the same b/c we all pay the same? (hopefully, lol)
Cool info. Seriously!
In this case though, Washington does not have state income tax, so of course they will take home more.
I’d be interested to see how these balance the cost of living, for example with https://www.nerdwallet.com/cost-of-living-calculator
Yes, SF and Seattle have higher income, but they’re also much higher cost of living compared with some of the other cities.
I could be wrong, but I think this significantly overstates the impact of taxation for most people. Income and taxable income can be very different. Even if you know taxable income, credits can reduce taxation below the total calculated base on taxable income.
Money used for pretax retirement savings (401(k)s, IRAs, etc.) is not taxed. Having kids reduces taxes. Active efforts at legally reducing taxes can work.
So when you say TC I’m assuming you mean not just bonuses but also vested RSUs where you take the tax up front, right?
Somewhat interesting, but ignores cost of living in the different places.
Interesting chart. But just so people know, [levels.fyi](http://levels.fyi) is mostly for FAANG companies so the salaries are skewed higher, pay from smaller companies is lower than this.
Reminds me of the first site I built during my bootcamp. I got the Cost of Living Index from the 110 largest cities in the US, and would then scrape glassdoor for a users searched job title and compare the salary vs the Cost of Living to create a “relative pay”.
Hawaii was always lowest because it CoL was so high and pay pretty low, Austin was usually high because the pay was pretty good and CoL quite low. This was in 2017 but looking at your graph it seems like not much changed.
Edit: my site is down now unfortunately, glassdoor changed their URL structure so my scraper broke as well as my database service ending their free postgres option.
Every tax in CA is higher than MA. There’s no way someone in LA with the same salary takes home more. I also don’t believe the salaries in Portland and San Diego being higher than LA and Boston.
NYC doesn’t have the NYC tax also deducted on top of federal and state? or just didn’t fit in the description nicely?
At least one FAANG has NY in top pay bracket (along with Bay and Seattle) compared to LA, so doesn’t seem too accuratex
Somewhat interesting, but ignores cost of living in the different places…
This is interesting, although it does not paint the total picture. Ex cost of gas and electric in CA, or (much) higher property taxes in Texas.
NYC is missing the addition 3.8% city tax
Great point on Seattle. The lack of state income tax combined with relatively moderate COL compared to SF/NYC makes it pretty attractive. The levels.fyi data shows Seattle consistently in the top 3 for TC but the take-home math really does make it one of the best overall values for SWEs.
I’d really like to see the effects of the taxes with the same salaries and the average cost of living impacting them.