
![[OC] Illinois school attendance cratered during COVID and never came back. 8 years of data.](https://www.byteseu.com/wp-content/uploads/2026/03/f6i9mxx57lrg1-1024x536.png "[OC] Illinois school attendance cratered during COVID and never came back. 8 years of data.")

I pulled eight years of Illinois State Board of Education Report Card data (2018-2025), cross-referenced it with national ACT scores and Census poverty estimates, and charted it.
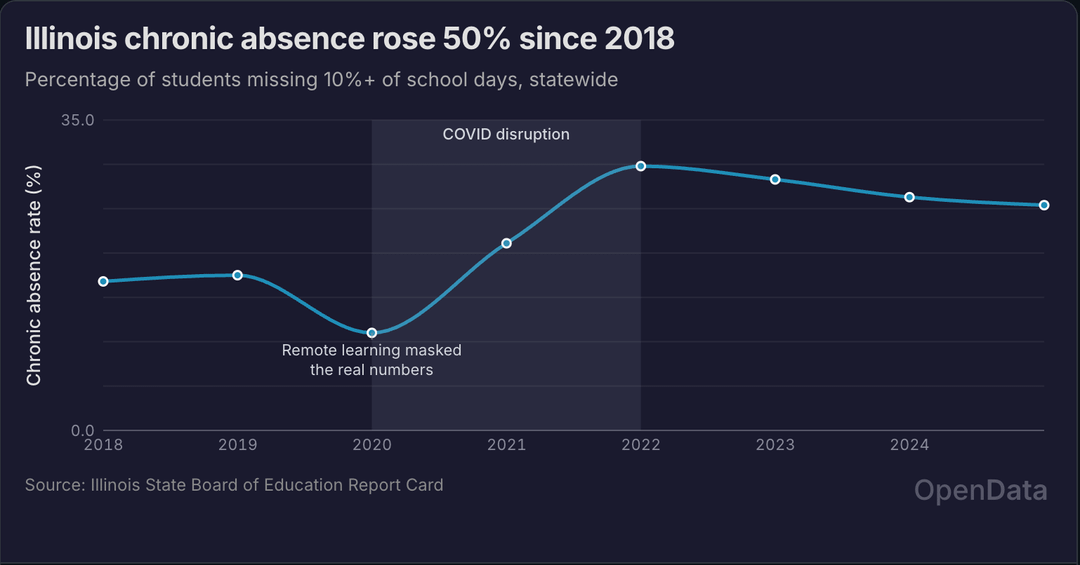
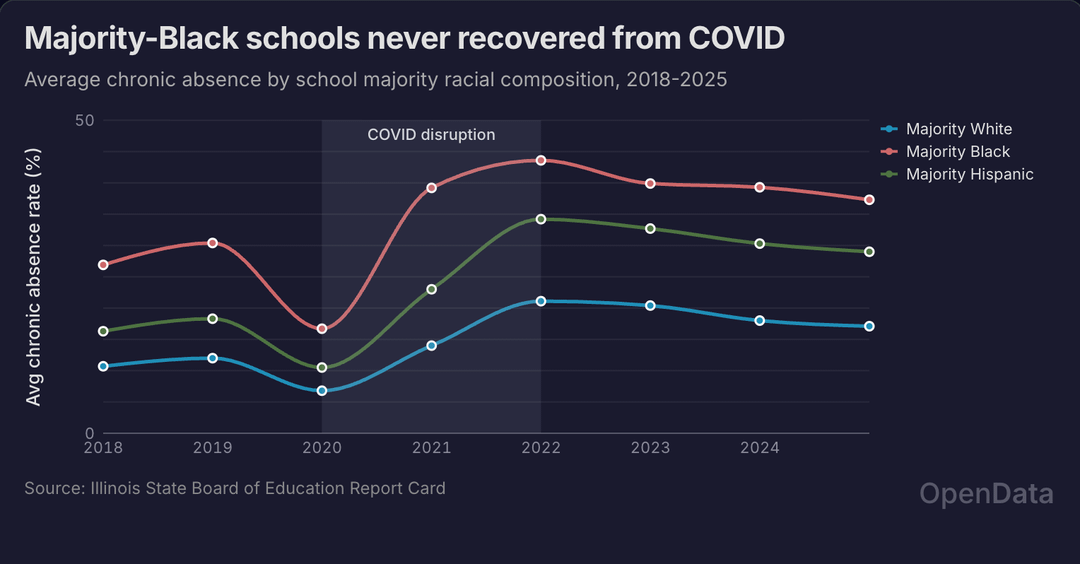
The common narrative is that COVID broke school attendance. The data tells a different story: things were already trending badly before 2020. COVID just significantly accelerated the problem, and three years later very little has recovered.
Before COVID: 16.8% of Illinois students were chronically absent in 2018 (missing 10%+ of school days). Already not great, and ticking up. That 2020 dip to 11% is misleading: "attendance" that year meant logging into a Zoom call.
After COVID: It spiked to 29.8% in 2022. By 2025 it's only come down to 25.4%: one in four kids. The recovery basically stalled, and the schools that were struggling before COVID are the ones that never bounced back at all.
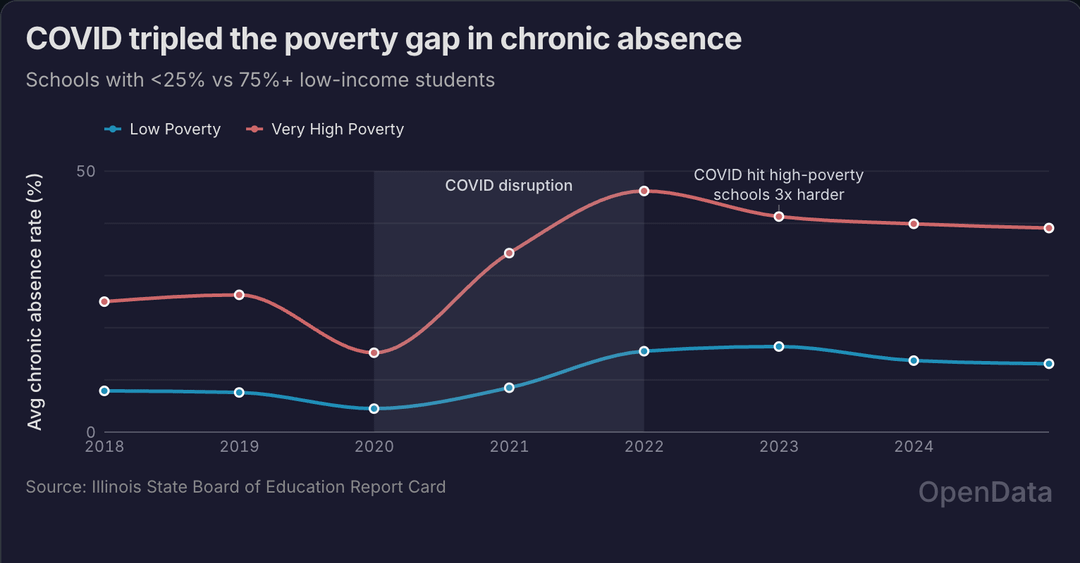
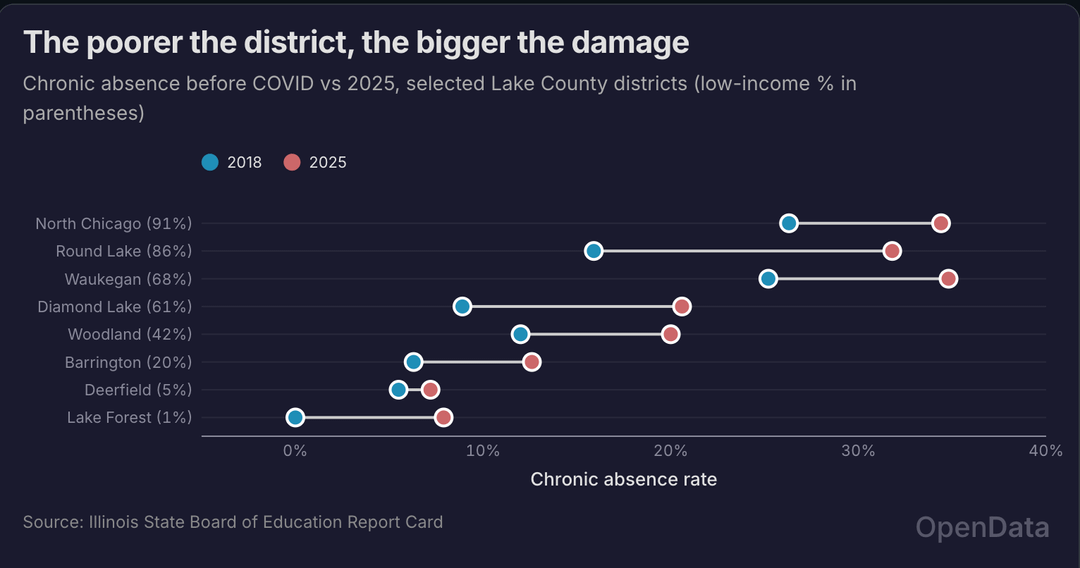
The poverty gap is where it gets stark. Before COVID, high-poverty schools had 17 points more chronic absence than low-poverty schools. After COVID, the gap blew out to 31 points. It's come down to 26, but it hasn't closed anywhere near pre-COVID levels. COVID hit high-poverty schools roughly 3x harder, and those schools are still stuck.
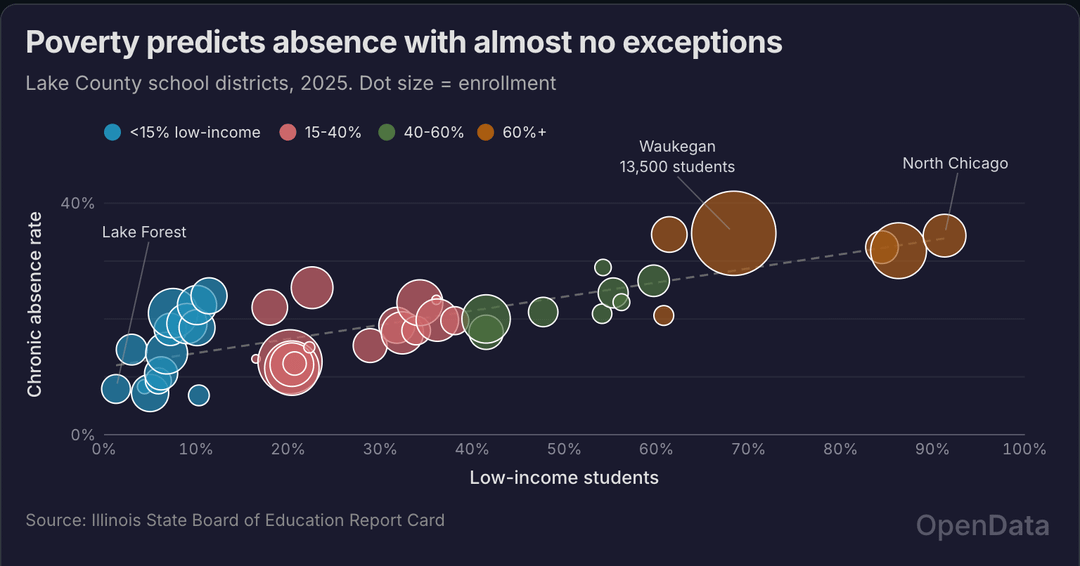
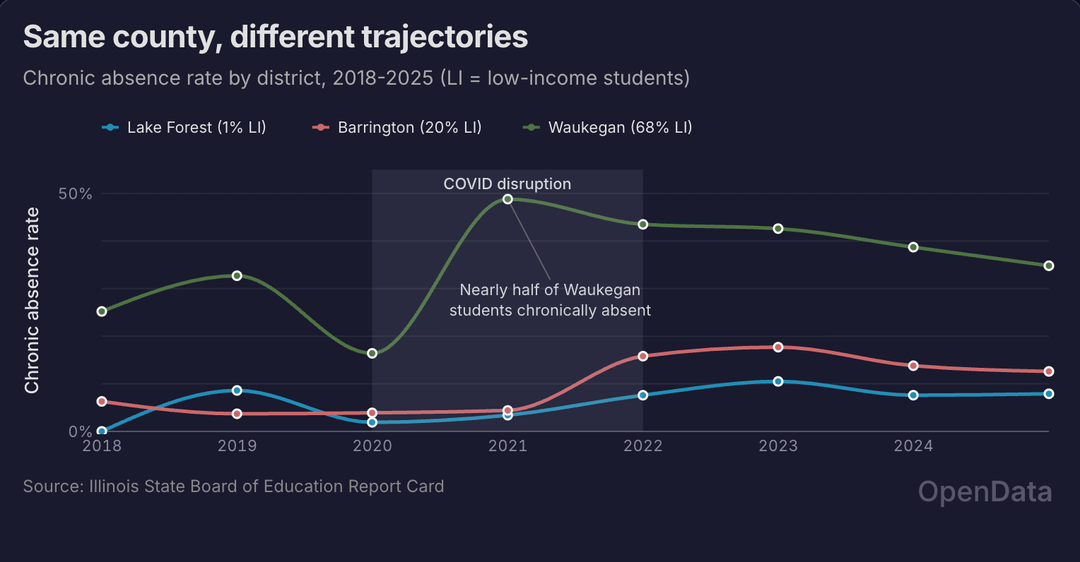
The Lake County example makes this more concrete:
- Lake Forest: 1.3% low-income, 7.9% chronic absence.
- North Chicago: 91% low-income, 34.4% chronic absence. These schools are six miles apart (in the same district). Chart 3 plots every district in the county by poverty rate vs. absence rate and it's basically a straight line.
Other things that stood out:
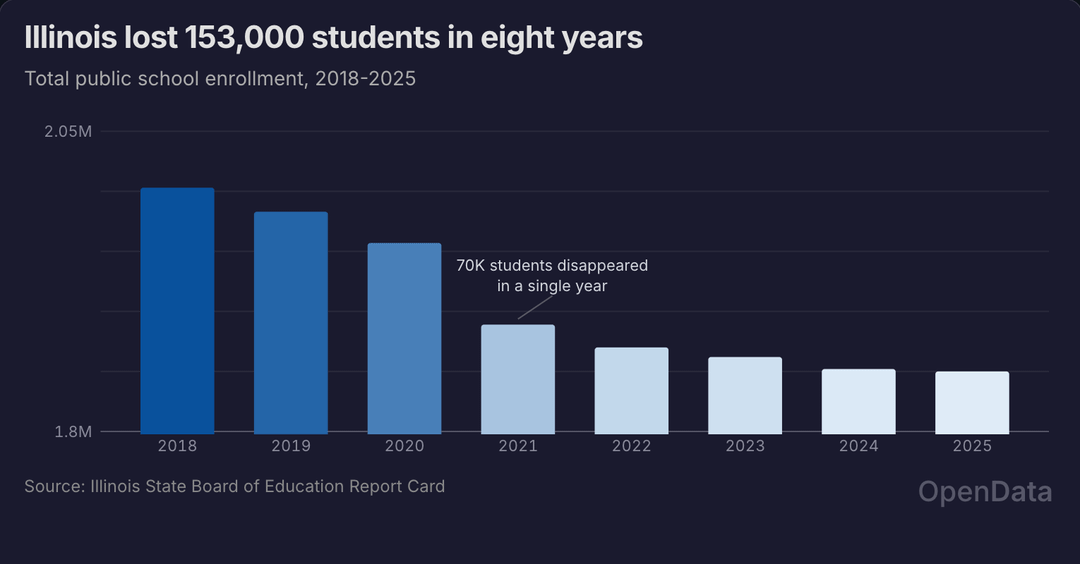
- Illinois lost 153,000 public school students over this period. The hypothesis is that wealthier families left for private schools or homeschooling during COVID and never came back. Statewide poverty actually fell, but school-level poverty concentrated. The kids who remained are poorer on average.
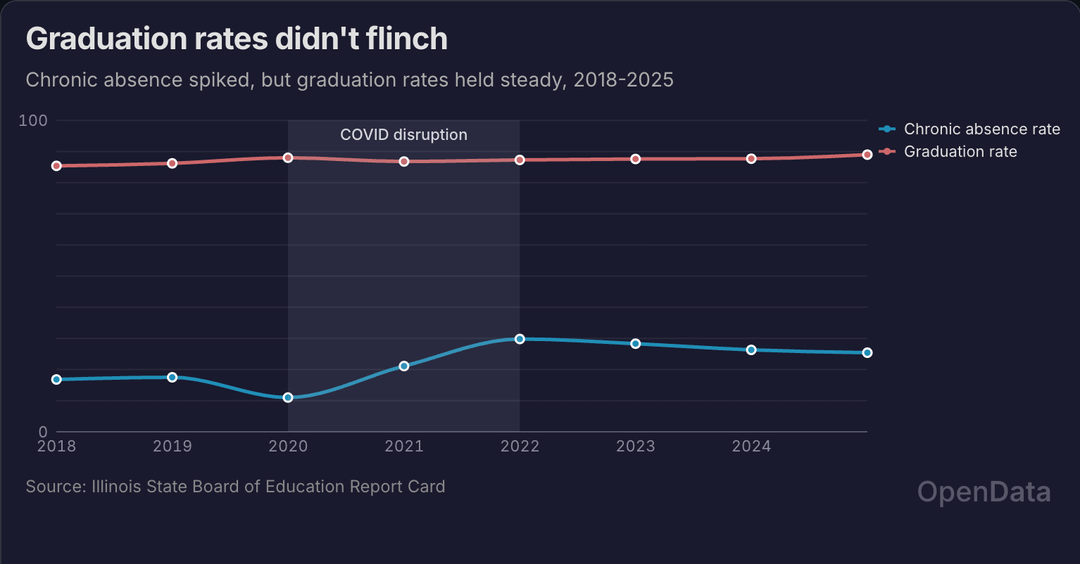
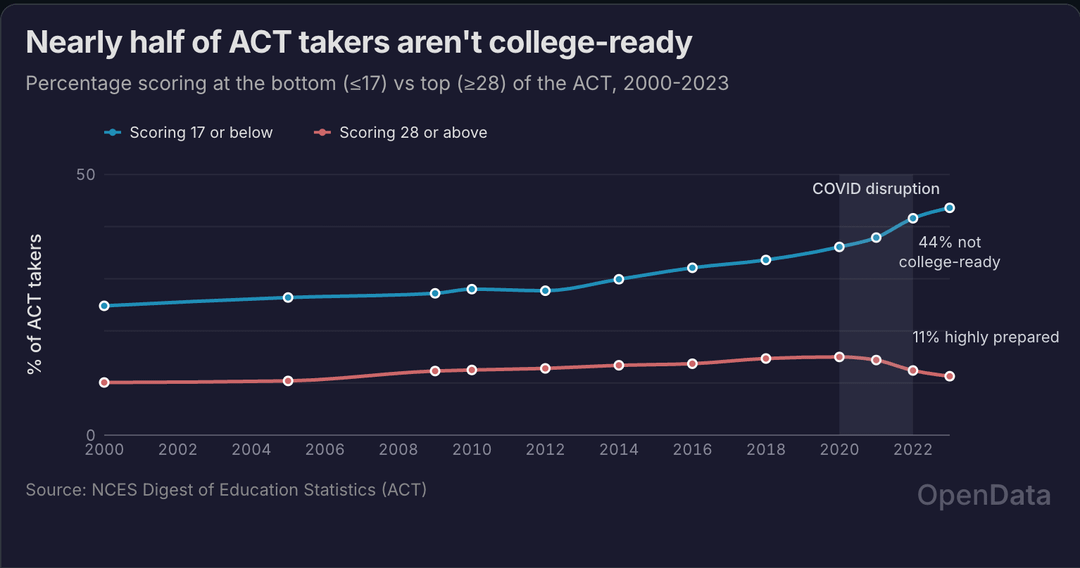
- Confusingly, graduation rates held steady at ~87-89% the whole time chronic absence was spiking 50%. Meanwhile, 44% of ACT takers now score below college-readiness (up from 25% in 2000). The hypothesis is: the diplomas kept printing, the actual learning didn't keep up.
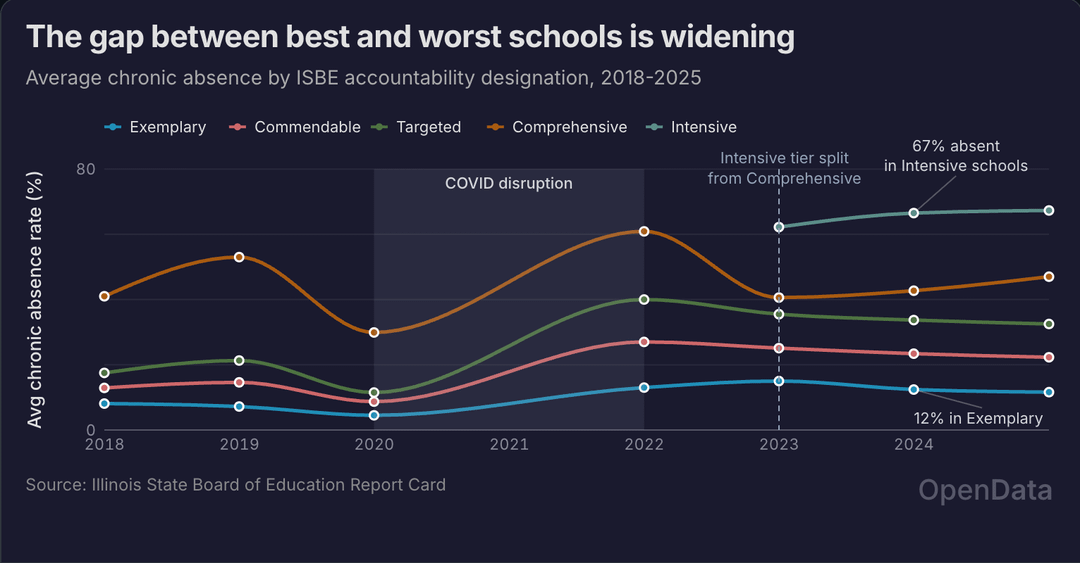
- The lowest-tier schools (ISBE's "Intensive" designation) have 67% chronic absence. The best schools: 12%. Same state. These were already different worlds before COVID. Now the gap is even wider.
Gallery: statewide trend, poverty gap, Lake County scatter plot, and the graduation-rate-vs-absence paradox.
Posted by No_Paramedic_4881
21 Comments
**Source(s):**
* Illinois State Board of Education Report Card (2018-2025) [http://isbe.net/pages/illinois-state-report-card-data.aspx](http://isbe.net/pages/illinois-state-report-card-data.aspx)
* ACT data from NCES Digest of Education Statistics [https://nces.ed.gov/programs/digest/d23/tables/xls/tabn226.60.xlsx](https://nces.ed.gov/programs/digest/d23/tables/xls/tabn226.60.xlsx)
* poverty estimates from Census SAIPE [https://www2.census.gov/programs-surveys/saipe/datasets/2018/2018-state-and-county/est18all.xls](https://www2.census.gov/programs-surveys/saipe/datasets/2018/2018-state-and-county/est18all.xls)
**Tools:**
* Built the charts with OpenChart (D3-based OpenSource charting library I work on). [https://github.com/tryopendata/openchart](https://github.com/tryopendata/openchart)
* The underlying datasets are on OpenData ([tryopendata.ai](https://tryopendata.ai)) if anyone wants to query them directly, the ISBE report card dataset has 13 pre-built views that break it down by year, county, poverty level, etc.
* Full writeup with all the charts and methodology: [https://labs.tryopendata.ai/illinois-schools-chronic-absence-crisis](https://labs.tryopendata.ai/illinois-schools-chronic-absence-crisis)
This is some deep level research, kudos to you!!
One question: Is chronic absence the cause or the symptom? If a kid is failing and disengaged, they don’t show up. If a kid has unstable housing, unreliable transport, or a parent working multiple jobs (poverty), they miss days. Are we measuring the outcome, or the root?
This matters because the solution flips. If absence causes failure, you punish families for missing school. If instability causes both absence and failure, you fix the instability (housing, meals, transportation, mental health) and attendance follows.
Your data makes a strong case that it’s the latter.
Public school enrollment is dropping somewhere in North America? That is mind blowing to me, in Alberta every school is way over capacity. They are adding new schools constantly and they are full before they open their doors.
What’s the mechanism behind chronic absenteeism in low income households? Where I’m from it was due to seasonal work, with lots of middle and high schoolers sitting out school to help their families with farm work. This was in a rural community in a different country though and I can’t imagine any of that is happening in Illinois. Is it a transportation issue? Parents that value education less and so less likely to push kids to go to school regularly? Or older kids being kept home to watch younger kids when they’re sick? Conversely, I would think that the promise of free food and childcare everyday would be an incentive for high attendance rates.
Yep. This is happening nationwide.
COVID and distance learning effectively gave ‘permission’ for many families just to stop sending their kids to school. It broke a social expectation that can’t be unbroken.
It really sucks. Impoverished kids are far less likely to intrinsically value education than non-impoverished kids, because being in poverty means that they usually don’t go home to a living example of how being successful in school translates to a financially secure life.
That turns into a vicious cycle. Not valuing education means not having access to higher education, means not having access to most financially comfortable middle class livelihoods, means raising kids who don’t value education because they don’t have examples of its value.
One of the worst long-term effects of COVID is how this will cause poverty to be amplified for an entire generation.
Slide 11 is the worst part. School is optional but they’ll still make it to the next grade and graduate. It’s horrible
This is also the product of a society that increasingly feels that education is a waste of time… “Keepin’ it real” sort of stuff. COVID may have provided an opportunity to move on that, but it’s the way things have been headed – especially in the USA.
People revel in their ignorance, and this is what happens when the example of ignorance is shown to children and even encouraged.
Thanks for doing this. I work in this arena in Michigan and can tell you our data are similar. Our chronically absent rates are improving a little, but are nowhere near the pre-pandemic levels. We also just reported our highest four year graduation rate for the 2024-25 school year. I wish this disparity was being made more public.
I love suspiciously timed posts from accounts that hide their post and comment history. ACT data is a bad measuring stick for most of your time frame. From 2017-2024, all Illinois students took the SAT their junior year as the state’s measuring stick. The ACT was only taken if a student choose to.
What’s interesting is when you see that Illinois has significantly added teachers to their schools while they have significantly lost enrollment.
https://edunomicslab.org/wp-content/uploads/2026/01/Illinois_24-25.jpeg
My kid is at the top of performers in her school. She is a chronic absentee.
Chronic absenteeism is inflated because kids are going on vacation trips.
You only need to miss 10% of school days, and you will be a chronic absentee.
Honestly, we decided the utility of having a family vacation was greater than missing a week of classes.
The real take home message from this data is schools are not teaching anything of value; whatever you miss in a week can easily be recovered. This is a reflection of lowering school standards since No Child Left Behind. Every child is allowed to matriculate no matter how little they’ve learned, as mentioned in OP. So why not take family vacations?
As for the difference between income levels — I suspect it is rich families taking weekend trips often, whereas poor families do the week-long vacation.
Great work, very well presented
I worked in public schools, a lot has to do with covid ptsd and a generation of kids whos social and learning development are far behind, we tried to return to normal too fast can cut the extea funding to soon as that funding was being used to pay for more social workers to help give kids the attention they needes. That covid generation that I like to call them are struggling and dropping out or being kicked out of school. No one cares or addressing it
Really nice job with the data presentation. Every question I had about the data was answered in the title, legend, or otherwise noted on the page. You did a great job of taking a huge amount of data and breaking it down into meaningful chunks that follow the logical progression of thought. Great write-up as well.
This is the content I subscribe for! Thanks for sharing!
COVID policies directly killed tens of thousands of people in the prime of their life. It ruined the lives of even more.
The removal of school and after school activities (including sports) led to an immediate and statistically significant rise in murder rates among at-risk youth. It also spiked suicides and overdoses. Overdoses made even worse by the massive influx of fentanyl due to border policies at the time. This isn’t some crazy right wing conspiracy. It’s documented and studied fact.
US had among the longest and most severe school closures in the developed world.
https://whyy.org/articles/philly-schools-are-back-but-strife-looms-over-covid-labor-and-building-problems/
536 days without in person school in Philadelphia
Imagine how much worse academic outcomes would be if those students were still attending. “Academic achievement has held strong through the pandemic” — after the worst decile dropped out.
The teachers unions should be ashamed of themselves for their advocacy to keep schools closed.
I really really wish the Y axes had more labels. 0 – max isn’t great. I get the intent is to show the relative change, but it is very hard to speak about the data in the visuals when I can’t identify one single data point with its actual numerical value. That’s not a beautiful data feature.
are these kids just at home? I would think poor parents would want to opt-in to sending their kids somewhere they don’t have to actively look after them.
It’s not confusing that graduation rates are the same while standardized test scores dropped despite missing class. The graduation standards are lower or non-existent. This is easily verifiable and widely known.
I like the style of these graphs, what tool did you use to visualize? Also can you link the dataset? I’m curious to see the data source