
![IVF clinics: relationship between success rates, patient age, and treatment burden [OC]](https://www.byteseu.com/wp-content/uploads/2026/04/d2fj7jrs9bsg1-1024x707.png "IVF clinics: relationship between success rates, patient age, and treatment burden [OC]")
I analyzed publicly available IVF clinic data from the CDC (2022) to understand what clinic “success rates” are actually capturing.
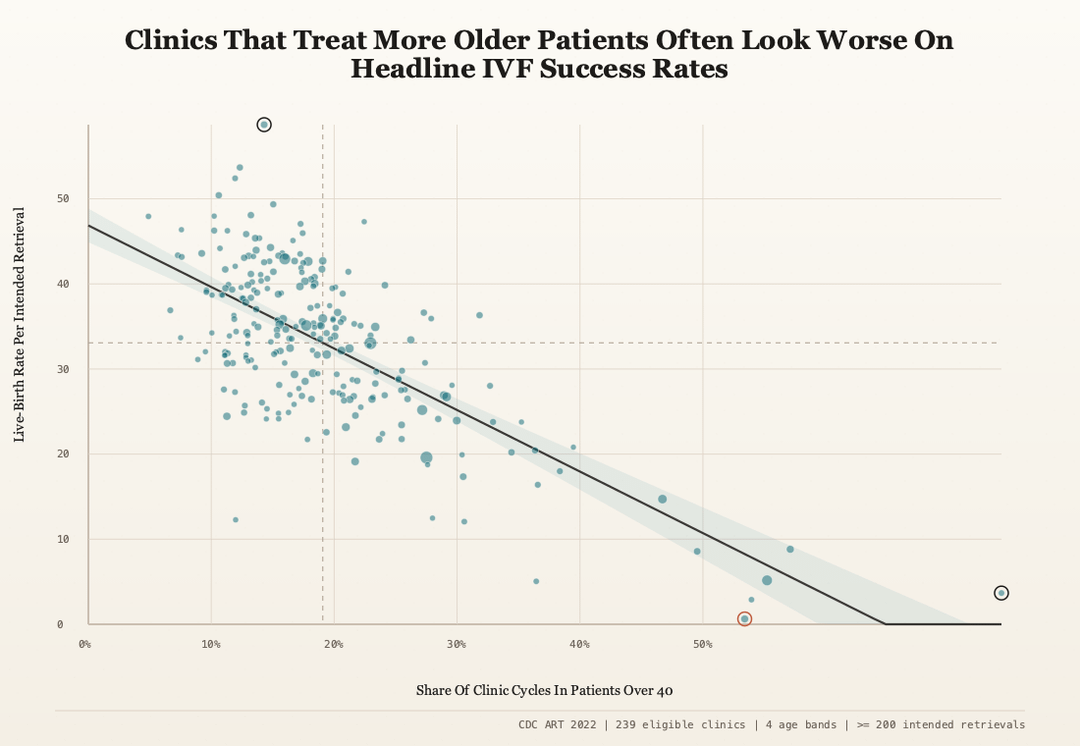
The first chart shows a strong negative relationship between a clinic’s reported success rate and the share of patients over age 40. Clinics treating older patients tend to report lower success rates, even if care quality is similar.
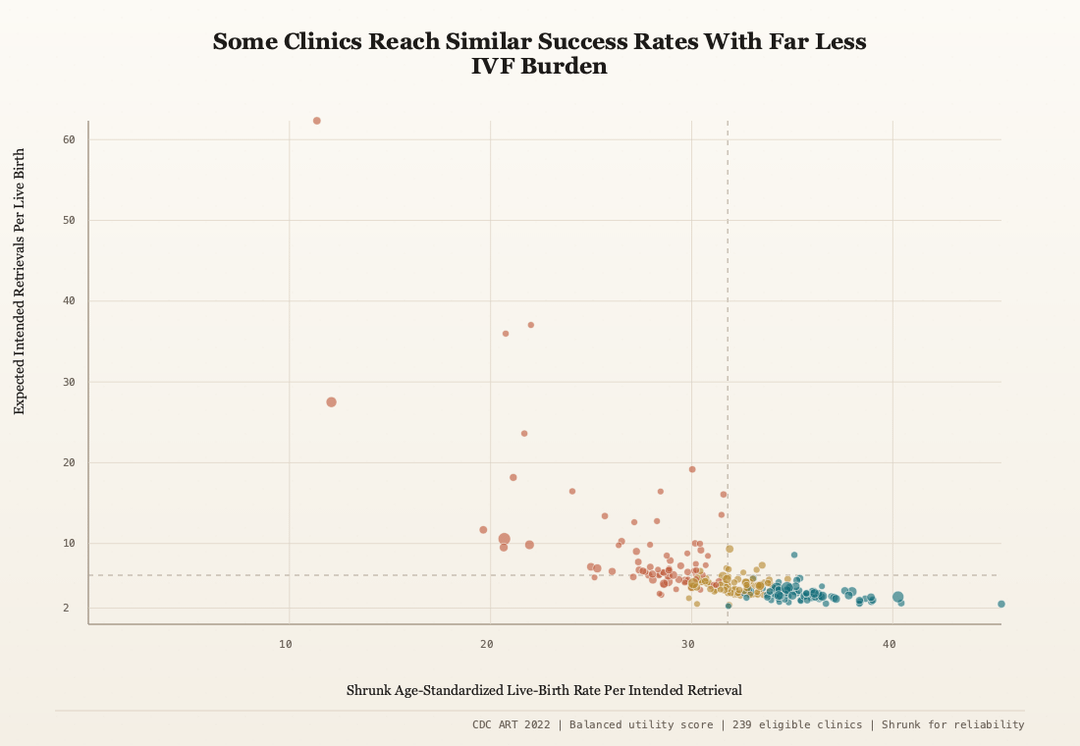
The second chart looks at success rates alongside treatment burden. While higher success often means fewer cycles to achieve a live birth, there is meaningful variation, some clinics reach similar outcomes but require substantially more treatment.
Together, these highlight a core issue: a single headline success rate mixes together patient demographics and treatment pathways. It’s not just measuring how well a clinic performs, it’s also reflecting who they treat and how treatment unfolds.
Full write-up:
https://falsepositive1.substack.com/p/the-fertility-clinic-success-rate
Posted by South-Bug7412
6 Comments
[OC]
Data source: CDC ART 2022 clinic-level public reporting data
Method:
– Chart 1: relationship between observed live-birth rate per intended retrieval and share of clinic cycles in patients over 40
– Chart 2: shrunk age-standardized live-birth rate per intended retrieval vs expected intended retrievals per live birth
– Filtered to 239 clinics with complete reporting across the four age bands (`<35`, `35-37`, `38-40`, `>40`) and at least 200 intended retrievals
– Age-standardized metrics use a common national age distribution derived from the eligible clinic sample
– Tools: Python (`pandas`) for analysis
Edit for clarity:
First plot:
* X-axis: % of patients over age 40 at the clinic
* Y-axis: success rate (chance of a live birth per IVF attempt)
Second plot:
* X-axis: success rate (chance of a live birth per IVF attempt, age-adjusted)
* Y-axis: number of IVF attempts needed on average to get one live birth
The axes of your plot are difficult to understand to people unfamiliar with this field.
If you’re going to post this here, you need to explain that first and clearly.
Very interesting. I know you’re defining burden as number of cycles, but it would be interesting to know if clinics with fewer cycles per live birth do more pre-cycle procedures or testing. Some of those procedures can be pretty invasive.
I’d be curious to know if the success rates include donor eggs/embryos (or donor sperm). I can see variation in how early IVF clinics convince people to use donors. If the clinic says you should use a donor after 3, then their success rate per cycle would be higher, but their percentage of “optimal success” (I.e., the couple having a biological child) might be lower.
I’d also be curious to know demographics and amount of cycles covered by the average insurance in the clinic. If most couples only try 3 times due to monetary reasons in one clinic, their success rate per number of cycles will be higher than a clinic where people can afford unlimited tries. If some of the “high number of cycle” users eventually have a child, they’re going to skew your ratio a lot.
Had a conversation with a woman that works for IVF clinics and this is one of her biggest peeves. A lot of these clinic with high success rates usually take on very young clients. “Perfect uteruses” she said.
Selection bias: are the most successful practitioners better at doing the thing, or at picking their subjects?
Who the hell are the patients undergoing 30-60 retrievals?! Those can’t be real people. Not only is it physiologically taxing but a cycle is >$20,000 USD.