That drop after 2021–22 is rough across basically every grade. Feels less like a single cohort issue and more like a system-wide shift.
Did you adjust for participation rates post-gap? I’m curious how much of that dip is actual proficiency vs who showed up to test.
bondguy4lyfe on
Similar trend across many states. Seems like the combination of Covid + digital learning (laptops/ipads) are probably to blame. I saw a news article today that Sweden is moving back to traditional books in classrooms.
-davros on
That colour scheme is awful! Very hard to tell at a glance the difference between grades 3 and 11, and 7 and all.
chewbaccasaux on
The trend down is concerning but so is the baseline. You mean – at best – we were ~40-50% proficient across all grades?
mainlydank on
As the kids say these days, we are cooked.
T_he_panda on
Are the people in grade 3 in 2015-16 the same people in grade 4 in 2016-17?
The % drop in insane if that is the case, close to 60% proficient when they were in Grade 3, then the following year (when in G4) only 40% proficient?
seanliam2k on
That grade 11 sure is concerning. I was a “slow” kid, who thankfully caught up but proficiency being in the minority is pretty wild for kids being sent off to university
joel1618 on
Makes sense. Look at whos having all the kids. Doesnt really matter though. AI is doing all the knowledge work anyway in the future.
Nomer77 on
Why was Grade 3 so much better than everyone else even back in the day?
MontEcola on
This graph shows one thing and exposes something different to me. Students were sent home in 2020, and had some version of on-line school in 21, and perhaps in 2022.
The data here shows that after disrupting the regular learning process that students are not catching up to the expected levels. They hit a rough spot and have not been able to recover.
In my opinion, that is a huge drawback in the educational system.
Instead of giving the kids time to catch up on what they missed, the schedule rolls on and the kids will be tested no matter what. Those who missed critical lessons are not getting the help they need. They just get moved to the next grade, the next level.
We see it since almost all kids had a very hard time during the lock downs and the after-math. (No apologies for the dad joke). What we don’t see in this graph is how an individual student gets lost in the shuffle when. there is a divorce, a family illness or some other emotional tragedy in a kid’s life.
KerPop42 on
Could I also see it by graduation year, instead of current grade? That way we can see consistent groups of kids change over time. Otherwise a line graph doesn’t make sense because the data isn’t continuous over time
Pess-Optimist on
On top of the interruption in learning from lockdowns at the beginning of the pandemic, it’s unsurprising that things haven’t gotten any better considering that COVID causes brain fog, memory loss, and reduced brain volume. Also, COVID weakens the immune system, so students are more sick than ever and missing school while sick or attempting to learn while sick. Not to mention the problems that come from screen time and AI.

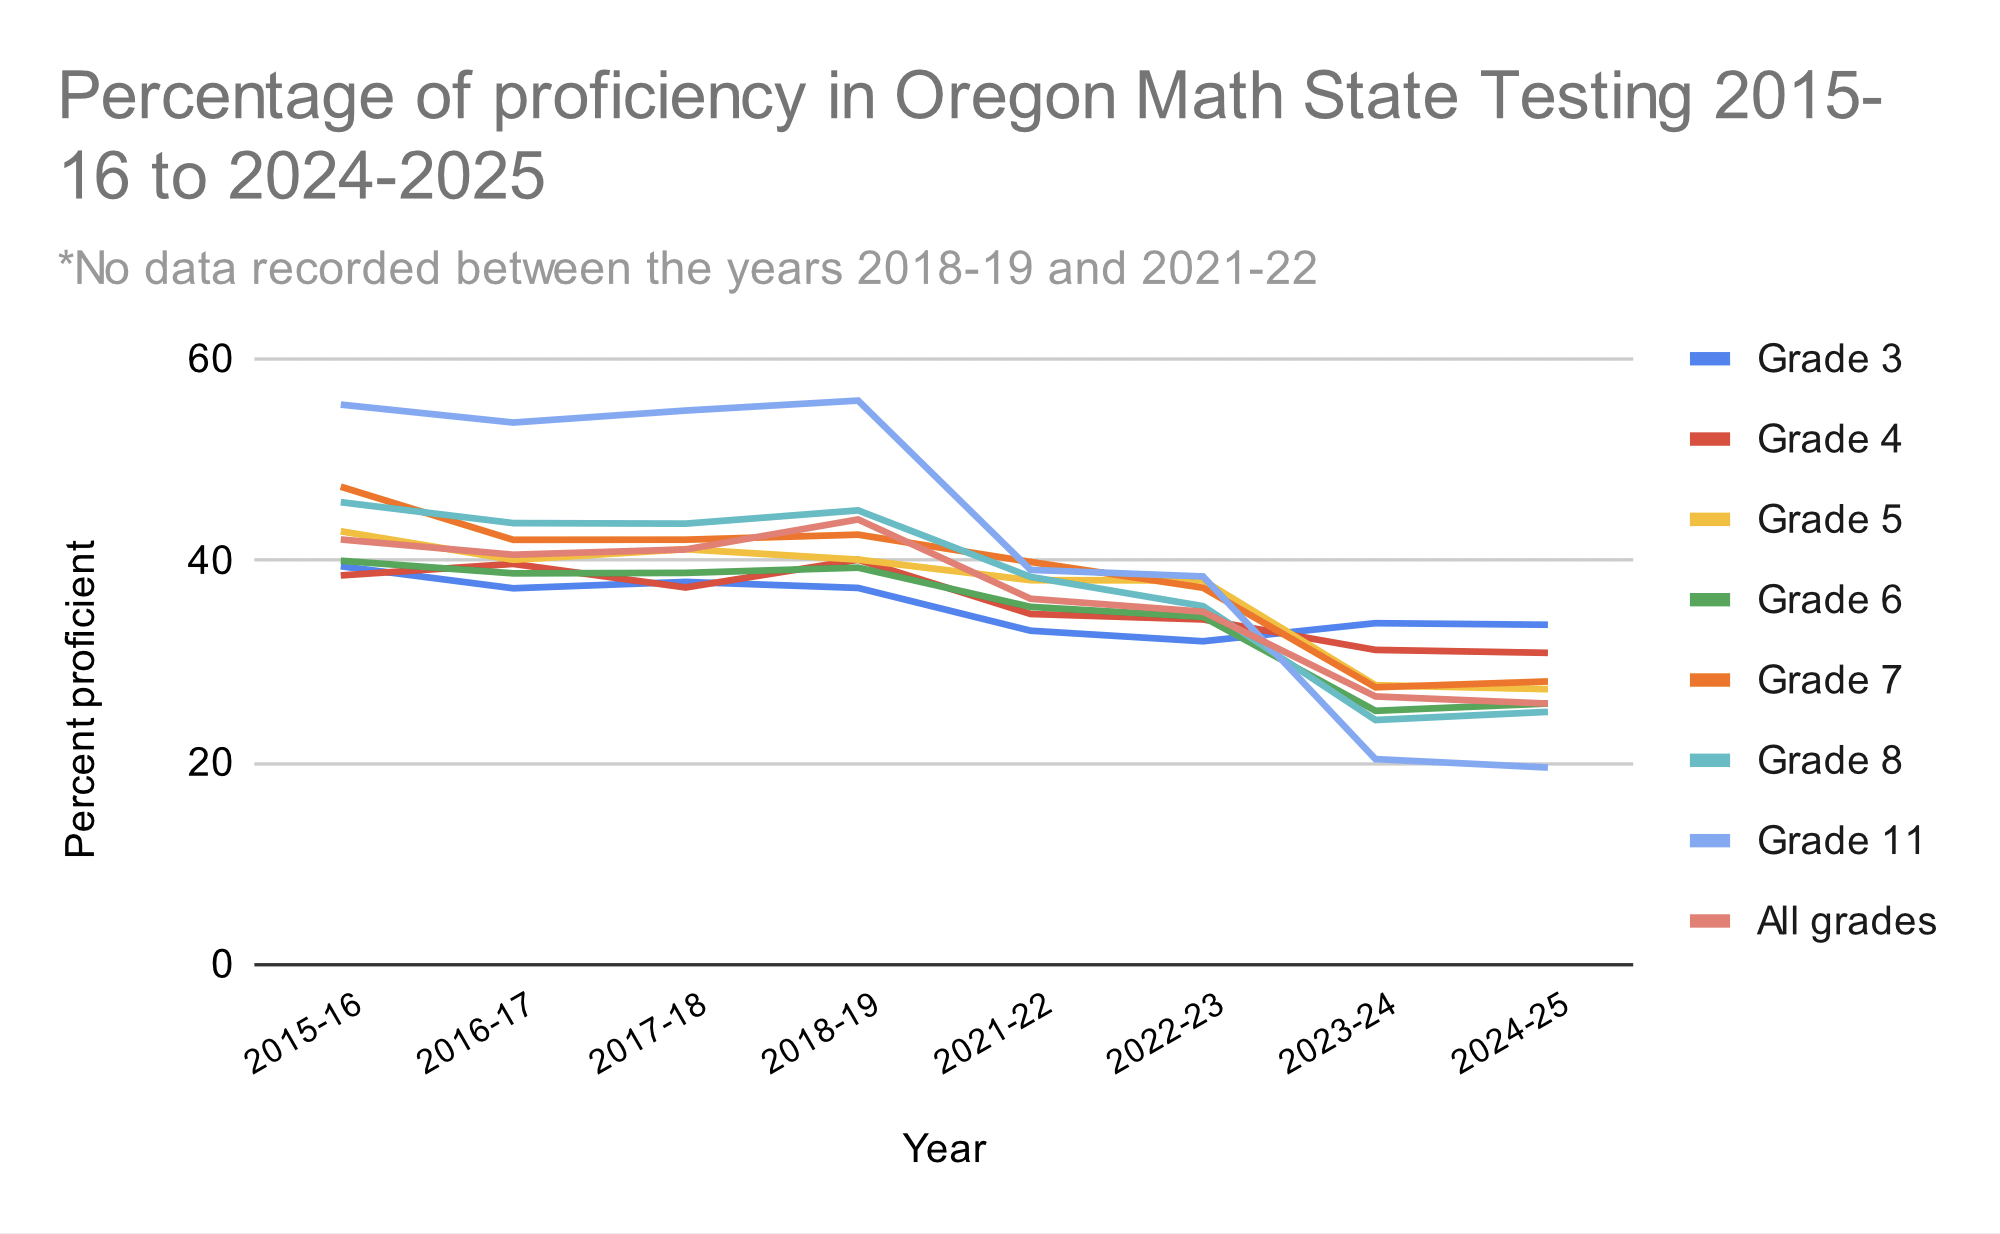
![[OC] Percentage of proficiency in Oregon Math State Testing from 2015-16 to 2024-25](https://www.byteseu.com/wp-content/uploads/2026/04/jmp3a2sykosg1-1536x948.png "[OC] Percentage of proficiency in Oregon Math State Testing from 2015-16 to 2024-25")
12 Comments
That drop after 2021–22 is rough across basically every grade. Feels less like a single cohort issue and more like a system-wide shift.
Did you adjust for participation rates post-gap? I’m curious how much of that dip is actual proficiency vs who showed up to test.
Similar trend across many states. Seems like the combination of Covid + digital learning (laptops/ipads) are probably to blame. I saw a news article today that Sweden is moving back to traditional books in classrooms.
That colour scheme is awful! Very hard to tell at a glance the difference between grades 3 and 11, and 7 and all.
The trend down is concerning but so is the baseline. You mean – at best – we were ~40-50% proficient across all grades?
As the kids say these days, we are cooked.
Are the people in grade 3 in 2015-16 the same people in grade 4 in 2016-17?
The % drop in insane if that is the case, close to 60% proficient when they were in Grade 3, then the following year (when in G4) only 40% proficient?
That grade 11 sure is concerning. I was a “slow” kid, who thankfully caught up but proficiency being in the minority is pretty wild for kids being sent off to university
Makes sense. Look at whos having all the kids. Doesnt really matter though. AI is doing all the knowledge work anyway in the future.
Why was Grade 3 so much better than everyone else even back in the day?
This graph shows one thing and exposes something different to me. Students were sent home in 2020, and had some version of on-line school in 21, and perhaps in 2022.
The data here shows that after disrupting the regular learning process that students are not catching up to the expected levels. They hit a rough spot and have not been able to recover.
In my opinion, that is a huge drawback in the educational system.
Instead of giving the kids time to catch up on what they missed, the schedule rolls on and the kids will be tested no matter what. Those who missed critical lessons are not getting the help they need. They just get moved to the next grade, the next level.
We see it since almost all kids had a very hard time during the lock downs and the after-math. (No apologies for the dad joke). What we don’t see in this graph is how an individual student gets lost in the shuffle when. there is a divorce, a family illness or some other emotional tragedy in a kid’s life.
Could I also see it by graduation year, instead of current grade? That way we can see consistent groups of kids change over time. Otherwise a line graph doesn’t make sense because the data isn’t continuous over time
On top of the interruption in learning from lockdowns at the beginning of the pandemic, it’s unsurprising that things haven’t gotten any better considering that COVID causes brain fog, memory loss, and reduced brain volume. Also, COVID weakens the immune system, so students are more sick than ever and missing school while sick or attempting to learn while sick. Not to mention the problems that come from screen time and AI.