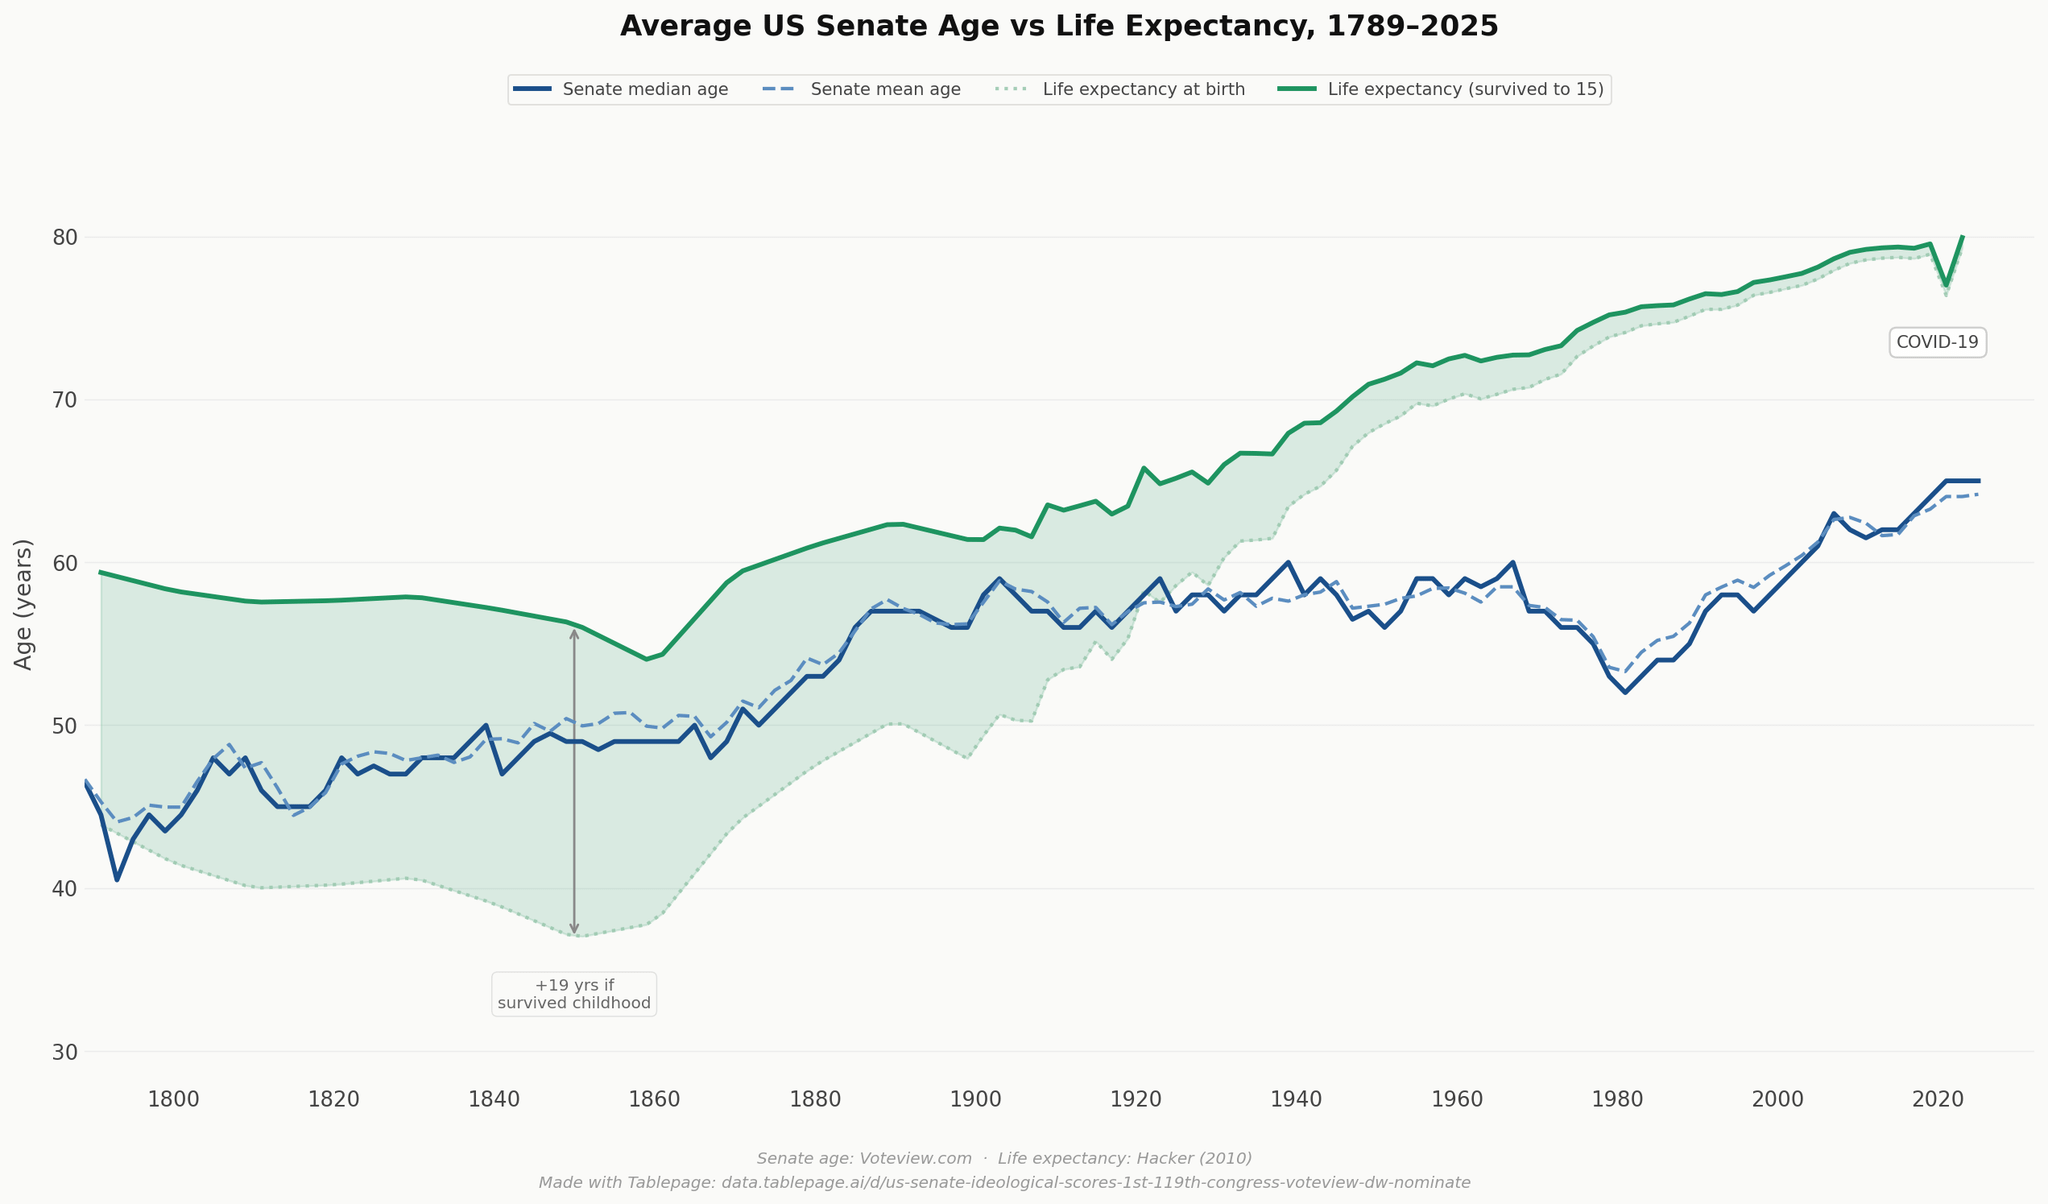
I don think the “+19 yrs if survived childhood” says what you mean it to say.
AgentEntropy on
If only USA’s declining life expectancies also affected US senators & Congress.
sithelephant on
With the major major caveat that senator life expectancy and normal person life expectency differ a _lot_.
Depending on dataset, you may literally be counting a population up to about 20% slaves and comparing them with the population of those who go on to become senators.
Top decile income life expectancy (or parental income at birth) might be easier to come by.
Intelligent-Luck-447 on
I’d remove life expectancy at birth from the plot, keeping only life expectancy *after childhood* clearly labeled.
My reasoning is because if you are a senator you have already passed childhood. This way there’s less noise on the plot.
kalvinoz on
A more interesting chat would be senate age (use median, using both adds nothing) compared with population age (median, median+std, median+2std).
magicmulder on
After 1980 is looks as if senators simply kept their seats forever.

![[OC] Average US Senate Age vs Life Expectancy, 1789-2025](https://www.byteseu.com/wp-content/uploads/2026/04/vsq3abgc1qsg1-1536x903.png "[OC] Average US Senate Age vs Life Expectancy, 1789-2025")
7 Comments
US Senate (Voteview): [https://voteview.com/static/data/out/members/Sall_members.csv](https://voteview.com/static/data/out/members/Sall_members.csv)
Life Expectancy (Hacker 2010): [https://github.com/owid/owid-datasets/tree/master/datasets](https://github.com/owid/owid-datasets/tree/master/datasets)
Built using pandas and matplotlib
Explored with [data.tablepage.ai/d/us-senate-members-voteview-d7042e](https://data.tablepage.ai/d/us-senate-ideological-scores-1st-119th-congress-voteview-dw-nominate)
I don think the “+19 yrs if survived childhood” says what you mean it to say.
If only USA’s declining life expectancies also affected US senators & Congress.
With the major major caveat that senator life expectancy and normal person life expectency differ a _lot_.
Depending on dataset, you may literally be counting a population up to about 20% slaves and comparing them with the population of those who go on to become senators.
Top decile income life expectancy (or parental income at birth) might be easier to come by.
I’d remove life expectancy at birth from the plot, keeping only life expectancy *after childhood* clearly labeled.
My reasoning is because if you are a senator you have already passed childhood. This way there’s less noise on the plot.
A more interesting chat would be senate age (use median, using both adds nothing) compared with population age (median, median+std, median+2std).
After 1980 is looks as if senators simply kept their seats forever.