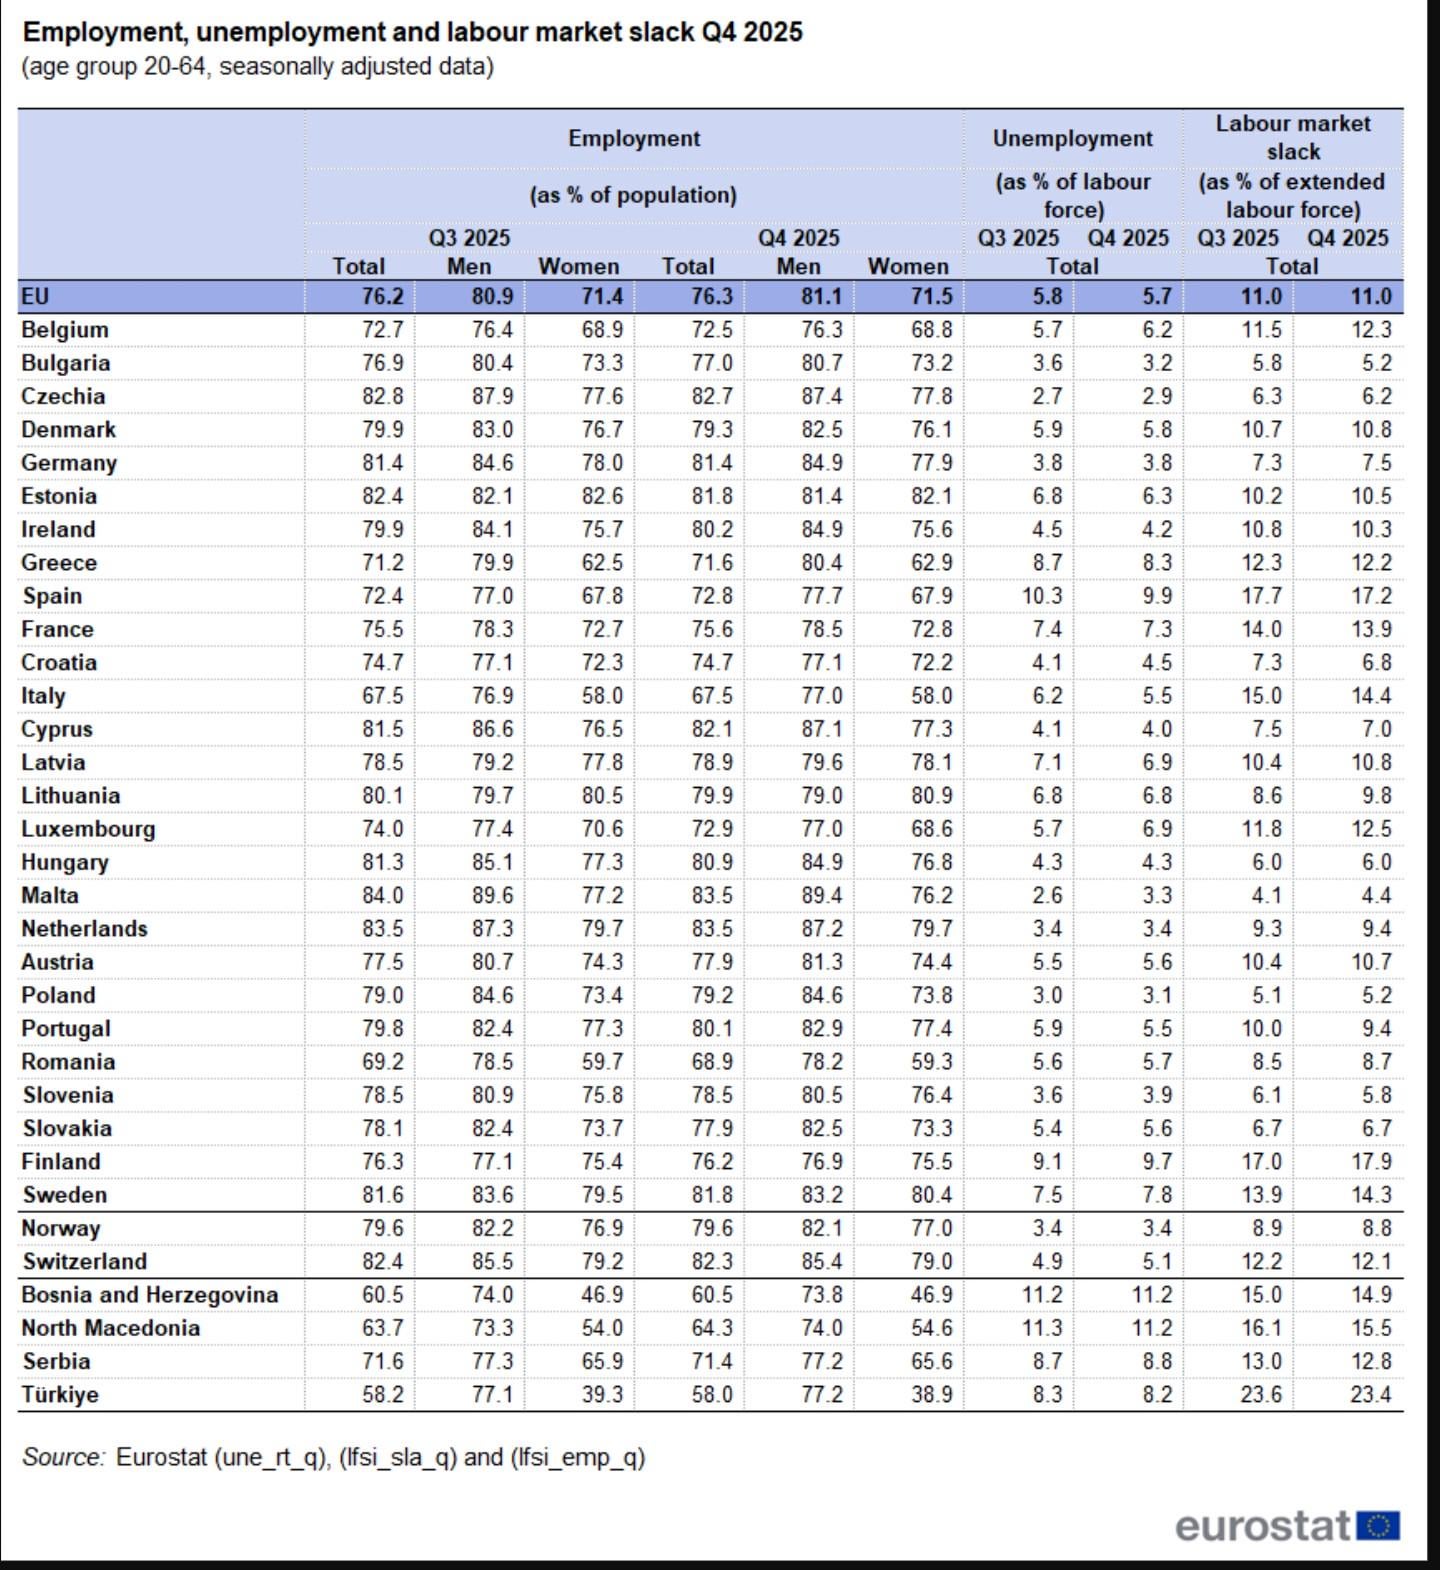
Finland’s employment rate is equal with France, a new Eurostat survey finds
https://i.redd.it/van25uzjq6tg1.jpeg
Posted by TinyAd1126


Finland’s employment rate is equal with France, a new Eurostat survey finds
https://i.redd.it/van25uzjq6tg1.jpeg
Posted by TinyAd1126
7 Comments
Source: https://ec.europa.eu/eurostat/statistics-explained/index.php?title=EU_labour_market_-_quarterly_statistics
You see a lot about Finland having such a terrible unemployment rating, so it’s interesting to see that while the actual employment rating isn’t great comparatively, it’s definitely not the worst. Better than countries like Belgium, France or Italy. I wonder what the reason is for Finland to have a higher number of non working people to be registered as unemployed. My guess is that part of it is that Finland has a high percentage of working women comparatively, and thus less housewives who aren’t registered as unemployed despite not having a job.
Something I also wonder if it has something to do with it, I myself was registered with the unemployment office despite having a part time job, as the money from working part time wasn’t enough to cover all my bills, until I eventually got a fulltime contract. The unemployment office in Finland is also pretty active in going after you when you lose your job
**What is the definition of labour market slack?**
“*Essentially labour market slack is the shortfall between the volume of work desired by workers and the actual volume of work available. Labour market slack also determines the difficulty or ease of employing more worker”.* [*https://www.economicshelp.org/blog/147987/economics/labour-market-slack/*](https://www.economicshelp.org/blog/147987/economics/labour-market-slack/)
“*Compared with Q3 2025, labour market slack increased in 14 countries in the EU in Q4 2025. The largest increases were reported in Lithuania (+1.2 pp), Finland (+0.9 pp), Belgium (+0.8 pp), and Luxembourg (+0.7 pp).*” [https://ec.europa.eu/eurostat/statistics-explained/index.php?title=EU_labour_market_-_quarterly_statistics](https://ec.europa.eu/eurostat/statistics-explained/index.php?title=EU_labour_market_-_quarterly_statistics)
Maybe its best you stick to shit you understand, than cherry picking random graphs that support your argument.
I read somewhere that unemployment rate is higher than even Spain (FI: 10.2% v/s spains 9.8%) . However my biggest concern isnt the fact of high figures but 0 will to create new jobs/taxing for everything and everyone for decreasing quality of infrastructure.
The title does not match with the numbers in the table posted.
Thats quarter 4 of 2025. Since then Finland has the worst employment rate in EU.
This convention to sort by the country’s name in its national language and not, you know, the one being isued, drives me *nuts*.