Equivalized income figures are not directly available for the US, the UK, and Canada; instead, they are estimated by dividing median disposable household income by the square root of household size, a simplified approach also used by the OECD. Canada is the only country in the chart for which 2023 data is used.
All income figures are sourced directly in national currencies and converted using purchasing power parity (PPP) conversion factors from the [World Bank](https://data.worldbank.org/indicator/PA.NUS.PPP). The Bulgarian figure was divided by 2 to account for discrepancy between EUR and BGN.
NeedToProgram on
Australia is kind of shocking to me. I figured they’d be closer to the UK’s
But my only real exposure is from hearing how expensive computer parts get there.
BasedInMunchen on
Can someone explain why Austria is sometimes in the top 5 for some things but sometimes doesn’t even make the top 15 for others?
Like in this Austria is top 5 but if you changed it to gdp per capita for eu countries I don’t think it makes top 5.
Same for happiness index, I feel like it doesn’t make top 10 but Wien is consistently in the top cities to live
Same for things like housing affordability and other stuff, I feel like it’s sometimes good and sometimes terrible depending on the metric
It’s not like Germany or Switzerland, which consistently performs well every time
noma887 on
In case anyone was curious (like me), here is the definition of equivalized household disposable income from the link provided by OP – “Disposable income is market income (income from work and capital) after accounting for public cash transfers received and direct taxes and social security contributions paid. It excludes in-kind services provided to households by governments and private entities, consumption taxes, and imputed income flows due to home ownership. After subtracting taxes and adding cash transfers, household income provides an indication of the goods and services families can purchase on the market. Household income is adjusted for differences in the needs of households of different sizes with an equivalence scale that divides household income by the square root of household size. The adjusted income is then attributed to every person in the household.”
[deleted] on
[deleted]
akie on
Sorry this has to be wrong because USA isn’t #1 and instead these Europoors are all in the same range or even outperforming us! /s
oli_99 on
Why didn’t they include Iceland?
MortalCoil on
I dont believe median work in Norway, average would be better
Kilbim on
Im curious if this takes into account healthcare costs or not. I’m sure the list would be different.
ZmajevaMuda on
In Austria people make 2500€/month, but in Switzerland its 6000 8000€ how are they even simila on the list

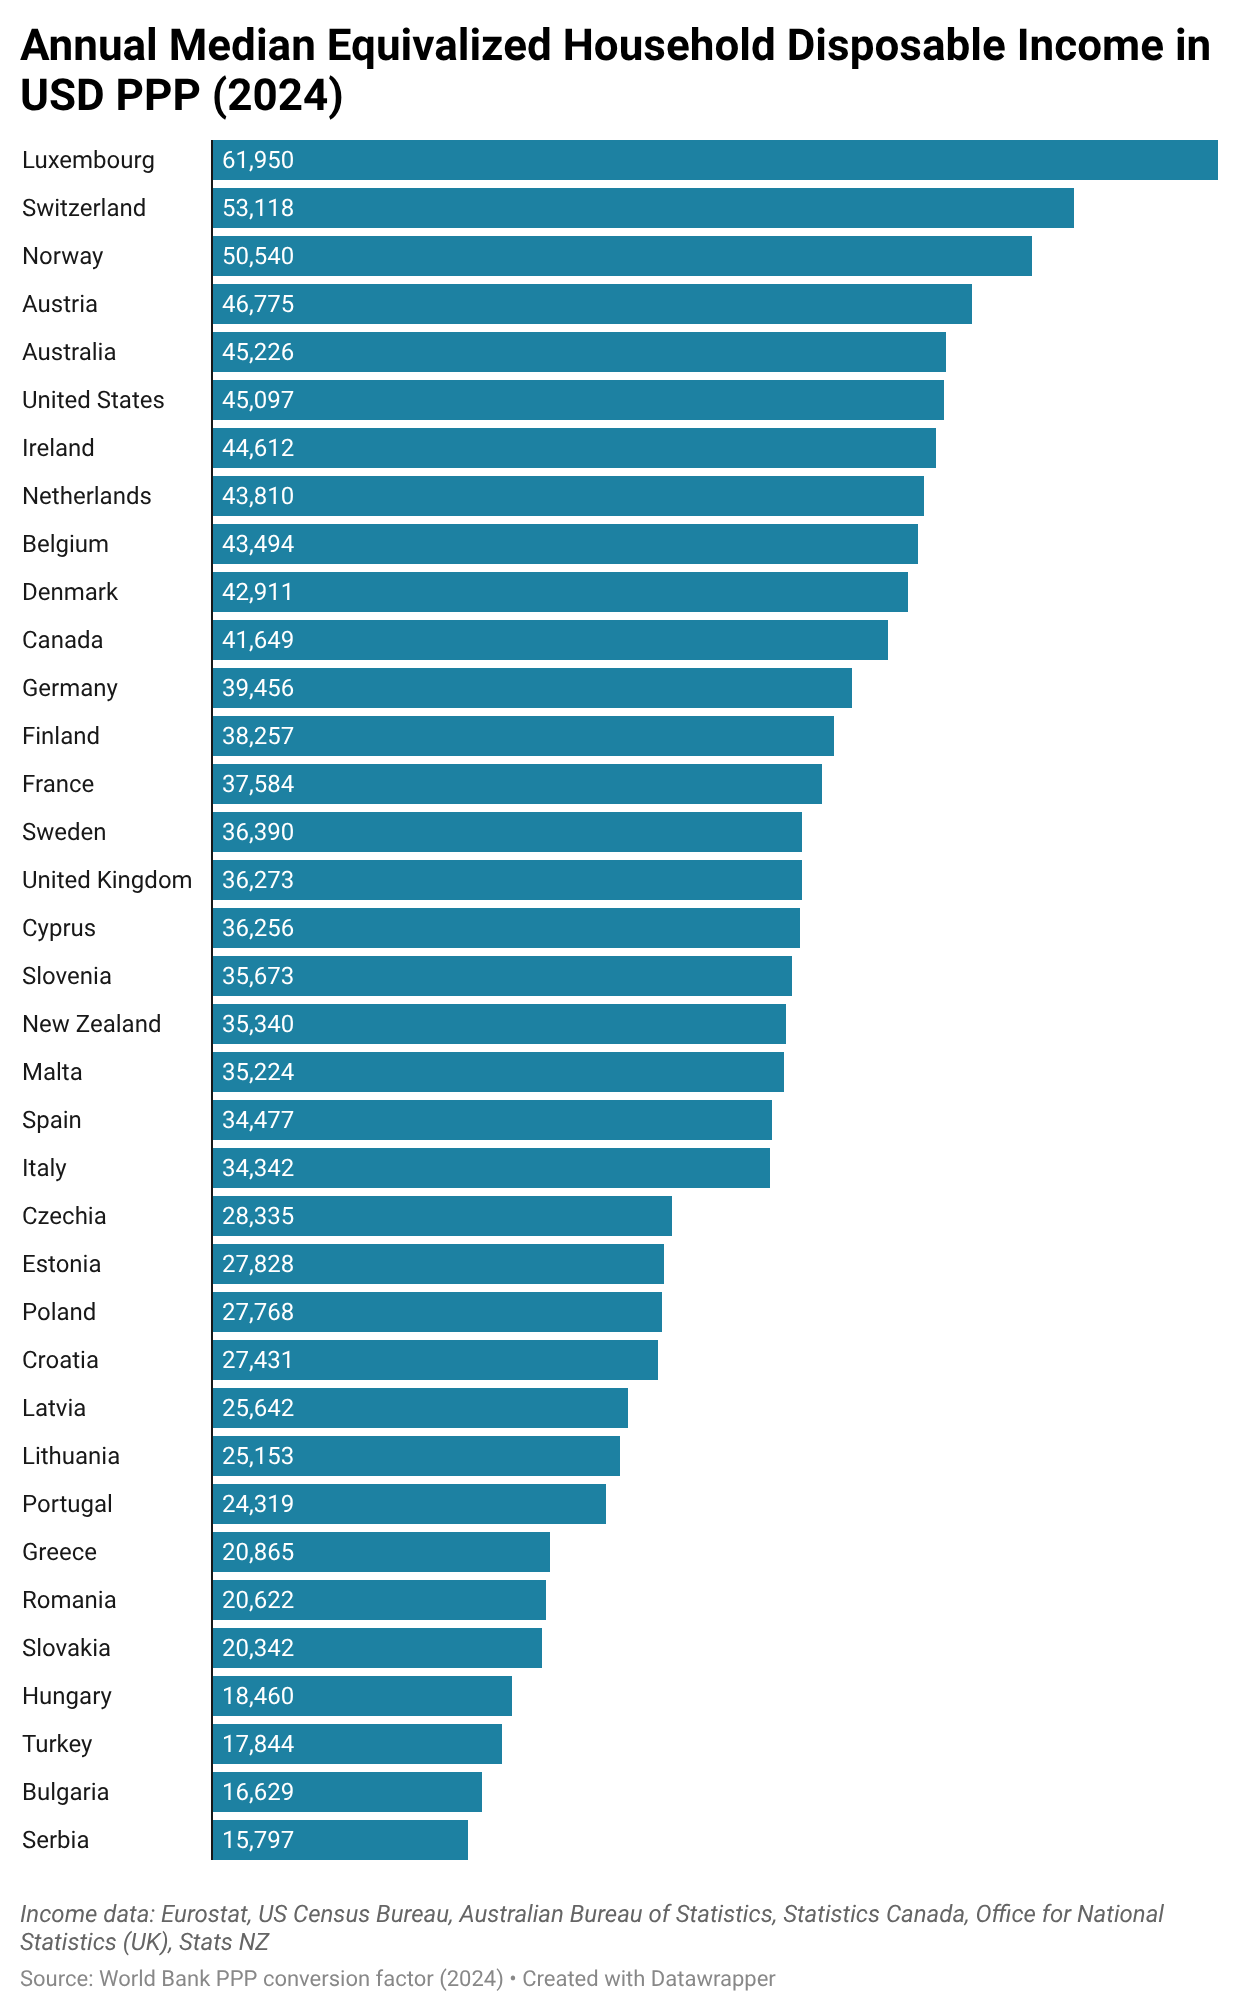
![[OC] Annual Median Equivalized Household Disposable Income in USD PPP (2024)](https://www.byteseu.com/wp-content/uploads/2026/04/53n022znr6tg1-947x1536.png "[OC] Annual Median Equivalized Household Disposable Income in USD PPP (2024)")
10 Comments
The chart covers all countries with median income data from [Eurostat](https://ec.europa.eu/eurostat/databrowser/view/ilc_di03__custom_18724193/default/table), along with the core Anglosphere (US, UK, Canada, Australia, and New Zealand). The methodology is consistent with the [2021 OECD chart](https://www.oecd.org/en/publications/society-at-a-glance-2024_918d8db3-en/full-report/household-income_3ee61044.html#title-b344384343), updated with the latest available data.
Equivalized income figures are not directly available for the US, the UK, and Canada; instead, they are estimated by dividing median disposable household income by the square root of household size, a simplified approach also used by the OECD. Canada is the only country in the chart for which 2023 data is used.
All income figures are sourced directly in national currencies and converted using purchasing power parity (PPP) conversion factors from the [World Bank](https://data.worldbank.org/indicator/PA.NUS.PPP). The Bulgarian figure was divided by 2 to account for discrepancy between EUR and BGN.
Australia is kind of shocking to me. I figured they’d be closer to the UK’s
But my only real exposure is from hearing how expensive computer parts get there.
Can someone explain why Austria is sometimes in the top 5 for some things but sometimes doesn’t even make the top 15 for others?
Like in this Austria is top 5 but if you changed it to gdp per capita for eu countries I don’t think it makes top 5.
Same for happiness index, I feel like it doesn’t make top 10 but Wien is consistently in the top cities to live
Same for things like housing affordability and other stuff, I feel like it’s sometimes good and sometimes terrible depending on the metric
It’s not like Germany or Switzerland, which consistently performs well every time
In case anyone was curious (like me), here is the definition of equivalized household disposable income from the link provided by OP – “Disposable income is market income (income from work and capital) after accounting for public cash transfers received and direct taxes and social security contributions paid. It excludes in-kind services provided to households by governments and private entities, consumption taxes, and imputed income flows due to home ownership. After subtracting taxes and adding cash transfers, household income provides an indication of the goods and services families can purchase on the market. Household income is adjusted for differences in the needs of households of different sizes with an equivalence scale that divides household income by the square root of household size. The adjusted income is then attributed to every person in the household.”
[deleted]
Sorry this has to be wrong because USA isn’t #1 and instead these Europoors are all in the same range or even outperforming us! /s
Why didn’t they include Iceland?
I dont believe median work in Norway, average would be better
Im curious if this takes into account healthcare costs or not. I’m sure the list would be different.
In Austria people make 2500€/month, but in Switzerland its 6000 8000€ how are they even simila on the list