
![[OC] Youth unemployment rates hide the real jobs crisis - comparing official vs. broader measures for the US and Canada](https://www.byteseu.com/wp-content/uploads/2026/04/j63ok3jvvutg1-969x1536.png "[OC] Youth unemployment rates hide the real jobs crisis – comparing official vs. broader measures for the US and Canada")
Sharing this since people always quote the unemployment rate like it's the whole picture — it's not even close.
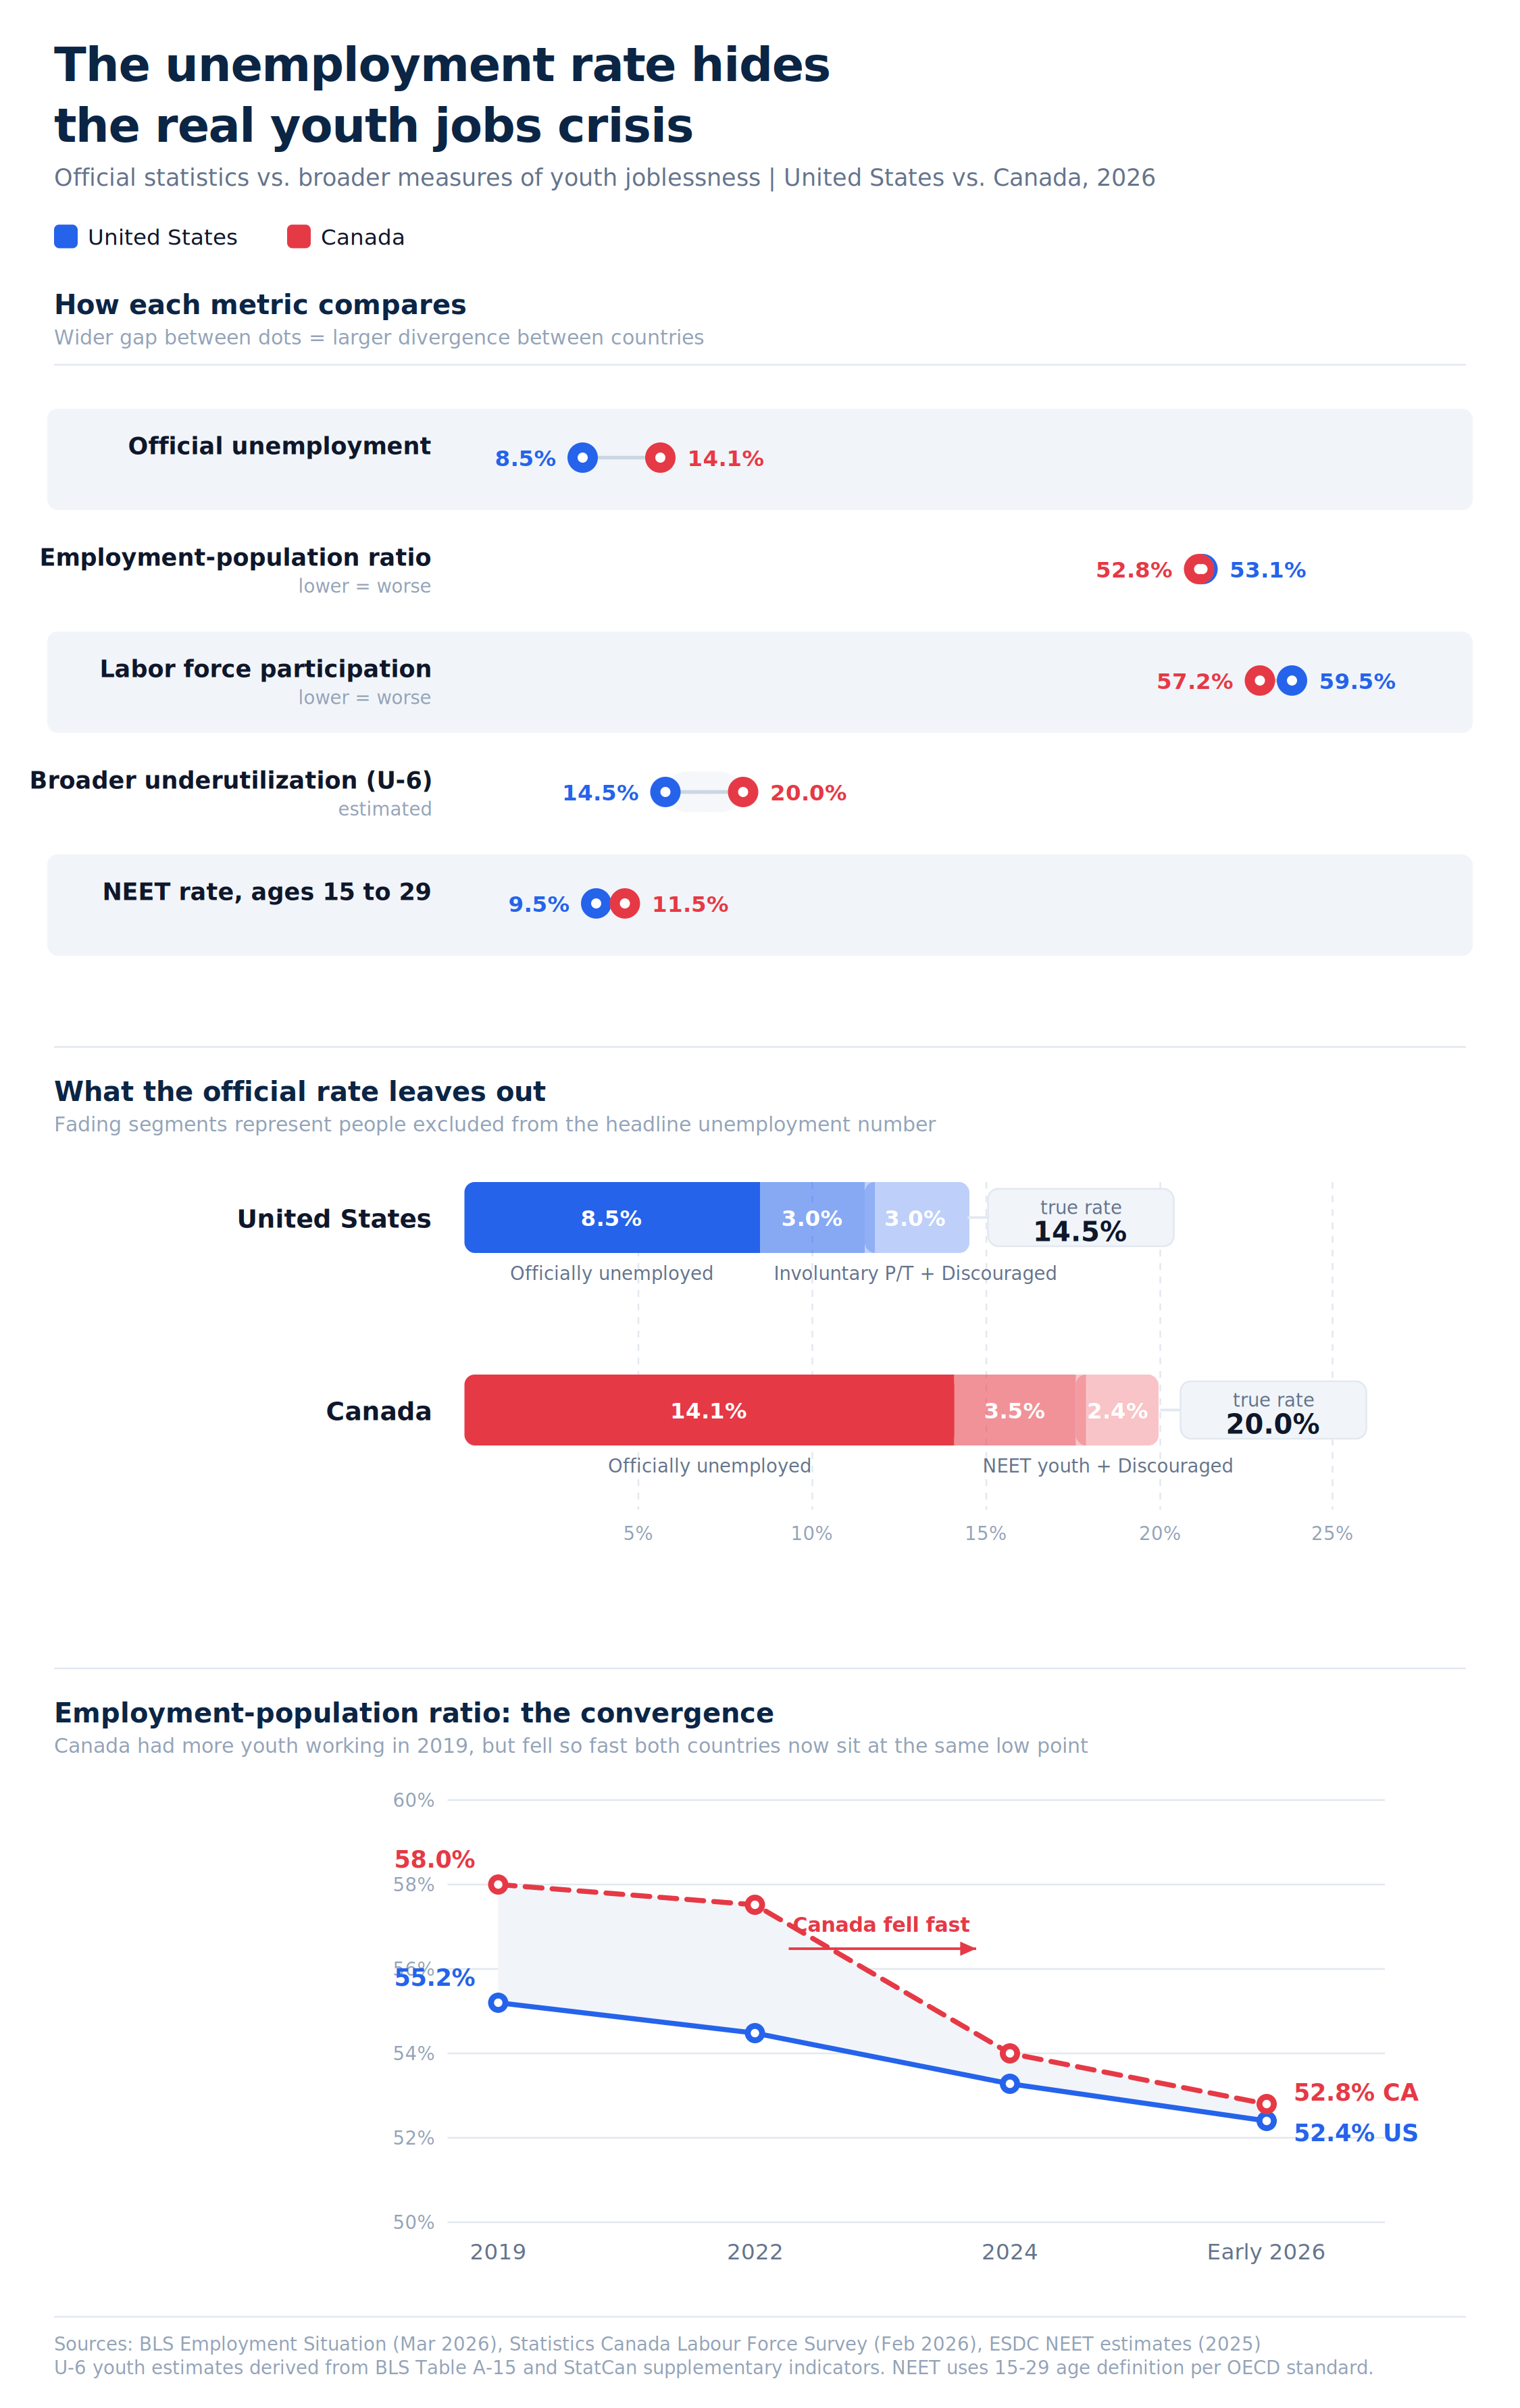
I kept running into the same frustration: someone says "youth unemployment is 8.5% in the US" or "14.1% in Canada" and the conversation stops there. But those numbers only count people actively job-hunting in the last four weeks.
So I pulled the actual data and built this to show what gets left out.
Data sources:
- US Bureau of Labor Statistics, Employment Situation release (March 2026) — unemployment rate, employment-population ratio, labor force participation, U-6 underutilization, discouraged workers
- Statistics Canada, Labour Force Survey (February 2026) — youth unemployment, employment rate, participation
- Employment and Social Development Canada (ESDC), Question Period Notes and "Building Canada Strong" discussion paper (2025) — NEET estimates for ages 15-29
- BLS Summer Youth report (July 2025) — historical employment-population ratios
Tools: Python (custom SVG generation), CairoSVG for PNG export. All chart elements hand-positioned — no chart library templates.
The official unemployment rate only counts people actively job-hunting. It misses discouraged workers who stopped looking, NEET youth (not in employment, education, or training), and people stuck in involuntary part-time work. When you add those back in, the US "true" youth underutilization is roughly 14.5% (vs. 8.5% official) and Canada's is around 20% (vs. 14.1% official).
The employment-population ratio tells the story the unemployment rate can't — Canada had more youth working than the US in 2019 (58% vs. 55.2%), but dropped so fast that both countries now sit at roughly the same low point (~52-53%). Canada's NEET population grew by over 200,000 in just two years to 914,000 youth aged 15-29.
Posted by jackjackjack2916
8 Comments
Sorry, can you define “involuntary part-time work”?
Claude aaah graph
Interesting data, really poorly displayed
This mirrors my experience as a retail wage-slave. Teenagers are competing against educated adults and retirement age adults for entry level positions. I can count on 1 hand the number of people i work with under the age of 21.
If you want to backup your headline, you’d need more historical data. I imagines there’s always been this much padding above the unemployment rate. There’s always articles on this acting like it’s something new
Ima be honest – this ain’t beautiful
Especially for youth, why is a lower employment to population ratio inherently worse? Obviously high NEET values are bad (although I would like to see the full time caregiver and disabled & unable to work numbers for that as well since we are talking about only ~14-20% of the population and 15-29 year olds are fairly likely to have young children). However, having higher rates of education and training is good for society overall and young people personally.
EDIT: Also, what are the age ranges for these different data sources? The BLS data for example has 16-19 and 20-24, but not 15-29.
Am I missing something? Canada’s official unemployment rate in Feb 2026 was 6.7%. Where is 14% coming from?
Wow, i wonder what happened to canada between 2022-2024 that caused youth unemployment to be that bad? (Rhetorical question, answer is insane levels of immigration)