Yeah, people usually get more intelligent the older they get.
EDIT: gleefully realizing no one here actually cares about data and its correlatives. Move along, Randal.
milespoints on
There is a lurking variable here (education).
timelessblur on
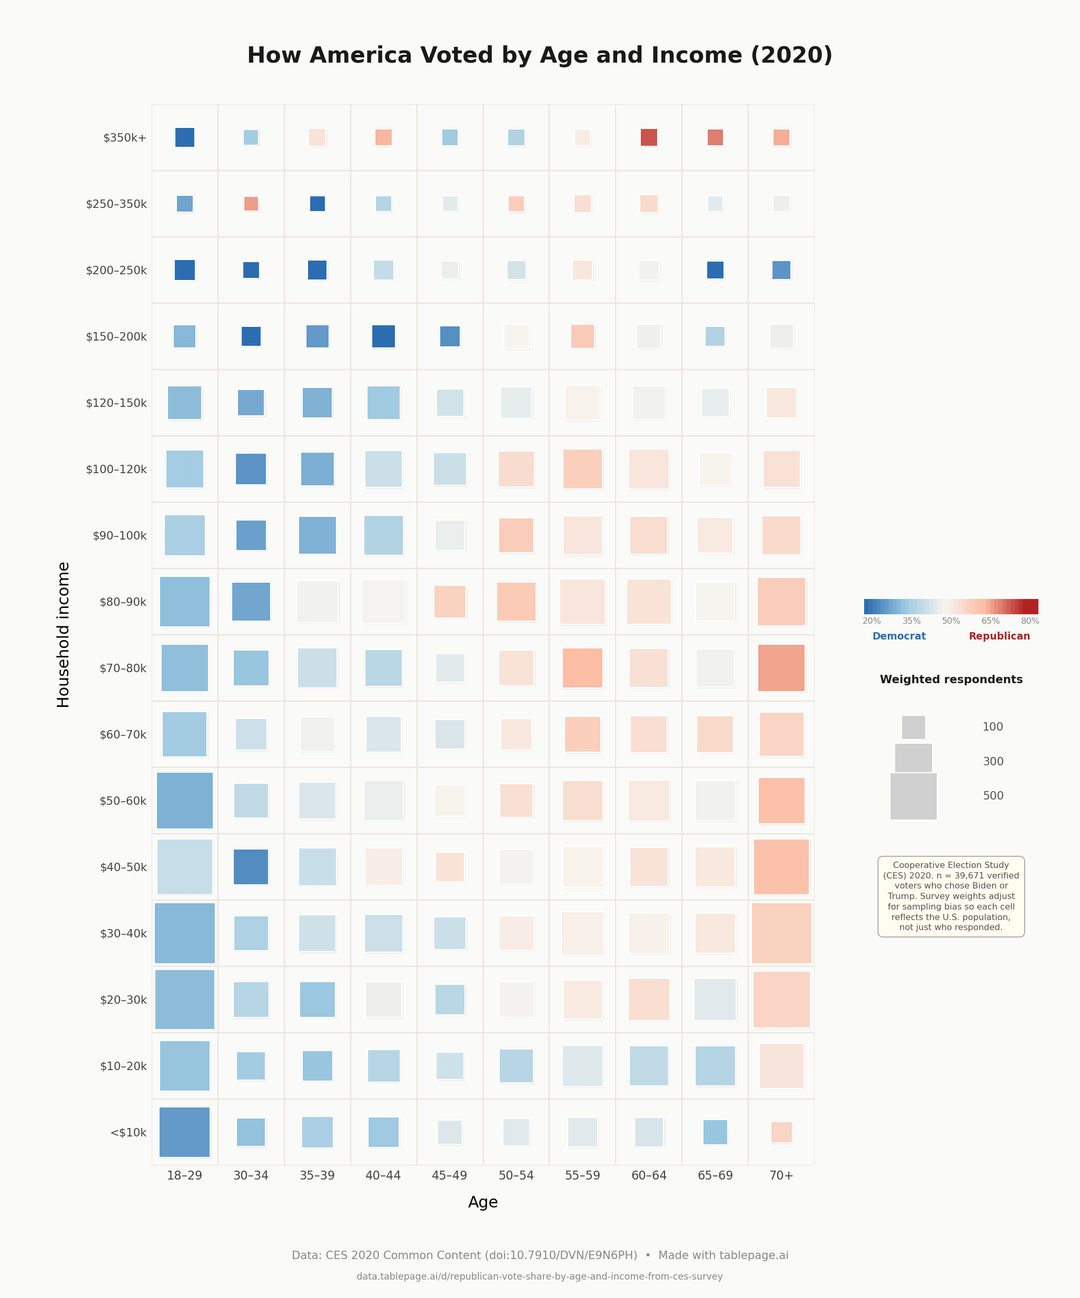
Let’s see the less you make and the older you are the more likely you are to vote Republican.
The thing is I have been looking at the age data for years and one thing I have noticed over all is republicans are getting older and that line of the swap moves up every year.
_________________1__ on
So +45yo middle class elected a current “leader” while a huge part of young people without money didn’t vote, they weren’t interested or they couldn’t afford to take a day off.
Definitely beautiful data.
RumplePanda8878 on
Having a hard time understanding the weight. Why are 18-29 and 70+ large?
makethislifecount on
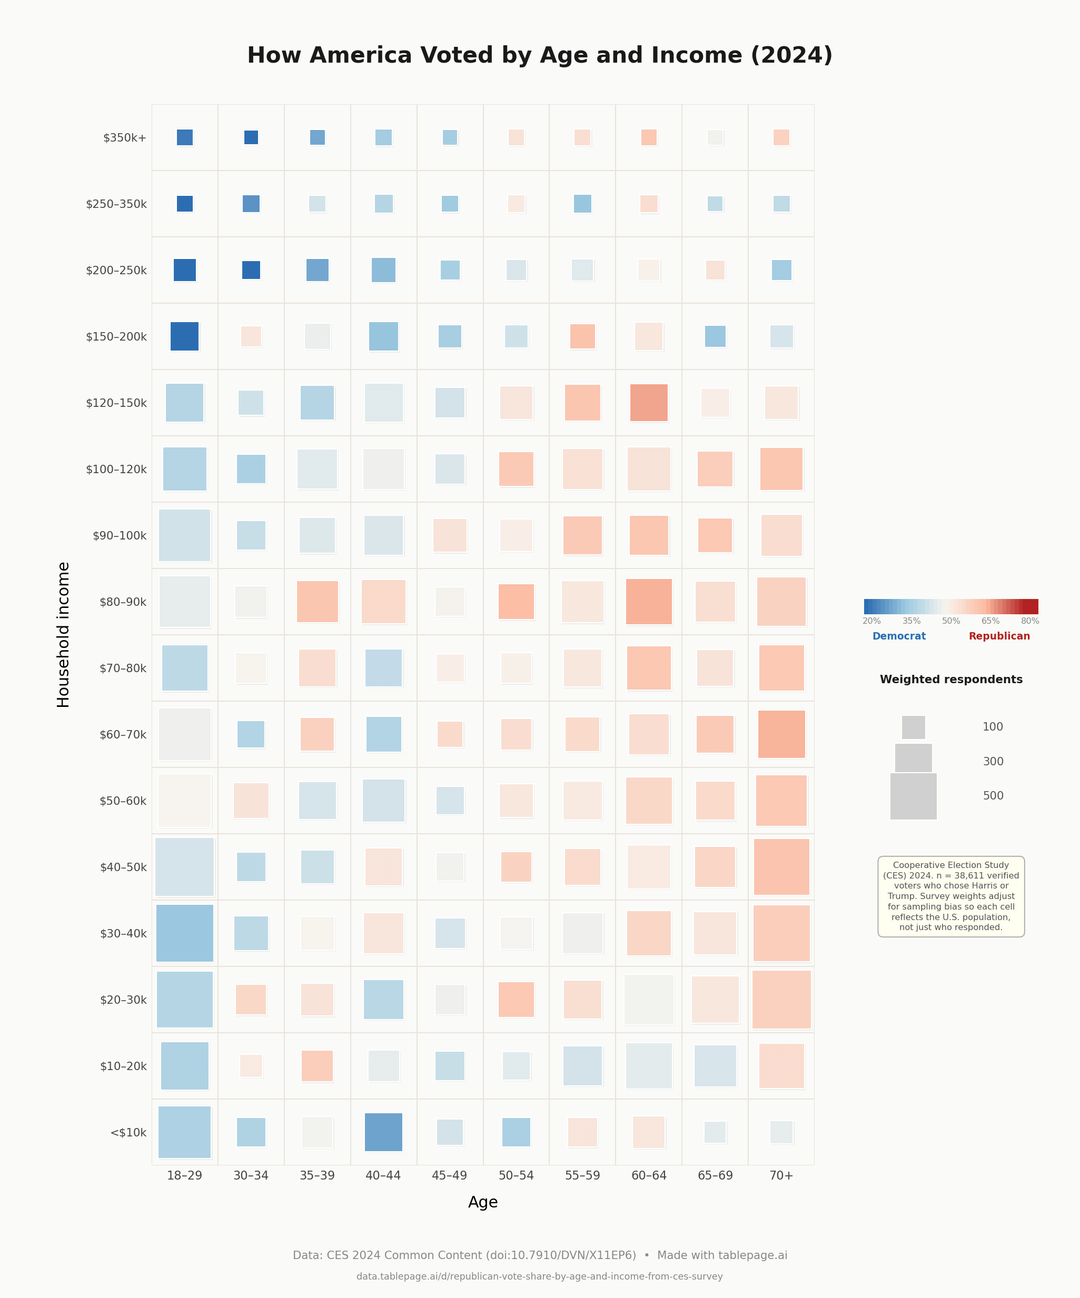
This is a good visualization. Really shows the loss of the lower income/working class voter base from 2020 to 2024 for the democrats. We need to get them back, we need policies and leaders who care about the common man’s welfare.
Macaburn3 on
What a fascinating and beautiful way to represent four dimensions.
Willthethe on
Cool data! I would suggest you split the 18-29 category into two buckets if possible, it’s more than twice as large as the other age buckets
millstone20 on
The old folks on social security and Medicare, mooching off the system, paying little tax, vote red. I knew your mental faculties declined at 70
lonewolf210 on
But everyone tells me that rich people are the evil republicans
PureFreshMentos on
That’s crazy. Insane how many lower income people vote against their own interest.
Analogmon on
Gen Z fucked up no surprise.
Oddsbod on
These kinds of vote-by-raw-income charts always give a bit of an incomplete picture, because actual cost of living and median income can vary enormously from place to place. Obviously both will skew much higher in urban areas and much lower in rural ones, so someone in the same income bracket could be living an essentially upper class lifestyle where an area with a higher cost of living would make that same income go much less further.
Turkino on
What’s up with that age 30 to 34, $150,000 to $200,000 bracket cuz that one shifted pretty hard.
LinaArhov on
Two trends are clear:
1) people get stupider as they get older with the very old being brain dead, and
2) middle income people are the stupider than low and high income ones
saveyourtissues on
Biggest trend I see is the bottom falling out for Dems under-40 regardless of income level. You see far less change for everyone above 40. There is also a red shift for under $20k, but it isn’t that pronounced.
Age played a far larger role than income and that runs counter to most people’s assumptions in the aftermath of the election. (Eg Dems lost young people vs Dems lost middle/working people)
electriclux on
We all know the only votes they count are in that upper right box.
bobevans33 on
I love this conceptually, but having the age buckets be different sizes skews the perspective. It makes it look like engagement/population is highest for the youngest and oldest, when in reality it is a much more gradual change.
I also think it might make more sense if we’re trying to compare across time to have the individual components directly adjacent or to derive a difference (difference in vote share, population change, etc.) to highlight the change more readily
kittenTakeover on
So basically it’s old poor people teaming up with old rich people to ruin the country. Sounds about like what everyone guessed.
Interesting-Note-399 on
The title of this is misleading. If you click the link, you will see that it is about how Republicans voted. The little chart on the side shows that the majority of the respondents were Republicans. To see that many Republicans voting for a Democrat is actually encouraging.
mystery_axolotl on
What’s the actual unit of the area of the squares?
apoca1ypse12 on
does this chart show hope, especially when those 60+ and 70+ become manure?
Prize_Farm4951 on
Maybe Logans Run wasn’t the dystopia masked as a utopia it was made out to be.
Jibber_Fight on
This is a horrible way of presenting any sort of data. Good grief.
TheQueefyQuiche on
So we get dumber as we get older and make more money….and we seem to be getting dumber faster and younger. That certainly explains a lot of the current situation!

![How America Voted by Age and Income (2020 vs. 2024) [OC]](https://www.byteseu.com/wp-content/uploads/2026/04/u2x2su69f3ug1-852x1024.png "How America Voted by Age and Income (2020 vs. 2024) [OC]")
26 Comments
Data: Cooperative Election Study 2020 & 2024 (doi:10.7910/DVN/E9N6PH, doi:10.7910/DVN/X11EP6)
Built using pandas, matplotlib, numpy
Explored with [data.tablepage.ai/d/republican-vote-share-by-age-and-income-from-ces-survey](http://data.tablepage.ai/d/republican-vote-share-by-age-and-income-from-ces-survey)
Yeah, people usually get more intelligent the older they get.
EDIT: gleefully realizing no one here actually cares about data and its correlatives. Move along, Randal.
There is a lurking variable here (education).
Let’s see the less you make and the older you are the more likely you are to vote Republican.
The thing is I have been looking at the age data for years and one thing I have noticed over all is republicans are getting older and that line of the swap moves up every year.
So +45yo middle class elected a current “leader” while a huge part of young people without money didn’t vote, they weren’t interested or they couldn’t afford to take a day off.
Definitely beautiful data.
Having a hard time understanding the weight. Why are 18-29 and 70+ large?
This is a good visualization. Really shows the loss of the lower income/working class voter base from 2020 to 2024 for the democrats. We need to get them back, we need policies and leaders who care about the common man’s welfare.
What a fascinating and beautiful way to represent four dimensions.
Cool data! I would suggest you split the 18-29 category into two buckets if possible, it’s more than twice as large as the other age buckets
The old folks on social security and Medicare, mooching off the system, paying little tax, vote red. I knew your mental faculties declined at 70
But everyone tells me that rich people are the evil republicans
That’s crazy. Insane how many lower income people vote against their own interest.
Gen Z fucked up no surprise.
These kinds of vote-by-raw-income charts always give a bit of an incomplete picture, because actual cost of living and median income can vary enormously from place to place. Obviously both will skew much higher in urban areas and much lower in rural ones, so someone in the same income bracket could be living an essentially upper class lifestyle where an area with a higher cost of living would make that same income go much less further.
What’s up with that age 30 to 34, $150,000 to $200,000 bracket cuz that one shifted pretty hard.
Two trends are clear:
1) people get stupider as they get older with the very old being brain dead, and
2) middle income people are the stupider than low and high income ones
Biggest trend I see is the bottom falling out for Dems under-40 regardless of income level. You see far less change for everyone above 40. There is also a red shift for under $20k, but it isn’t that pronounced.
Age played a far larger role than income and that runs counter to most people’s assumptions in the aftermath of the election. (Eg Dems lost young people vs Dems lost middle/working people)
We all know the only votes they count are in that upper right box.
I love this conceptually, but having the age buckets be different sizes skews the perspective. It makes it look like engagement/population is highest for the youngest and oldest, when in reality it is a much more gradual change.
I also think it might make more sense if we’re trying to compare across time to have the individual components directly adjacent or to derive a difference (difference in vote share, population change, etc.) to highlight the change more readily
So basically it’s old poor people teaming up with old rich people to ruin the country. Sounds about like what everyone guessed.
The title of this is misleading. If you click the link, you will see that it is about how Republicans voted. The little chart on the side shows that the majority of the respondents were Republicans. To see that many Republicans voting for a Democrat is actually encouraging.
What’s the actual unit of the area of the squares?
does this chart show hope, especially when those 60+ and 70+ become manure?
Maybe Logans Run wasn’t the dystopia masked as a utopia it was made out to be.
This is a horrible way of presenting any sort of data. Good grief.
So we get dumber as we get older and make more money….and we seem to be getting dumber faster and younger. That certainly explains a lot of the current situation!