
![[OC] I scored every month of the year for 39 destinations using 10 years of ERA5 climate data — v2](https://www.byteseu.com/wp-content/uploads/2026/04/tzzpdbm8zcvg1-1001x1536.png "[OC] I scored every month of the year for 39 destinations using 10 years of ERA5 climate data — v2")
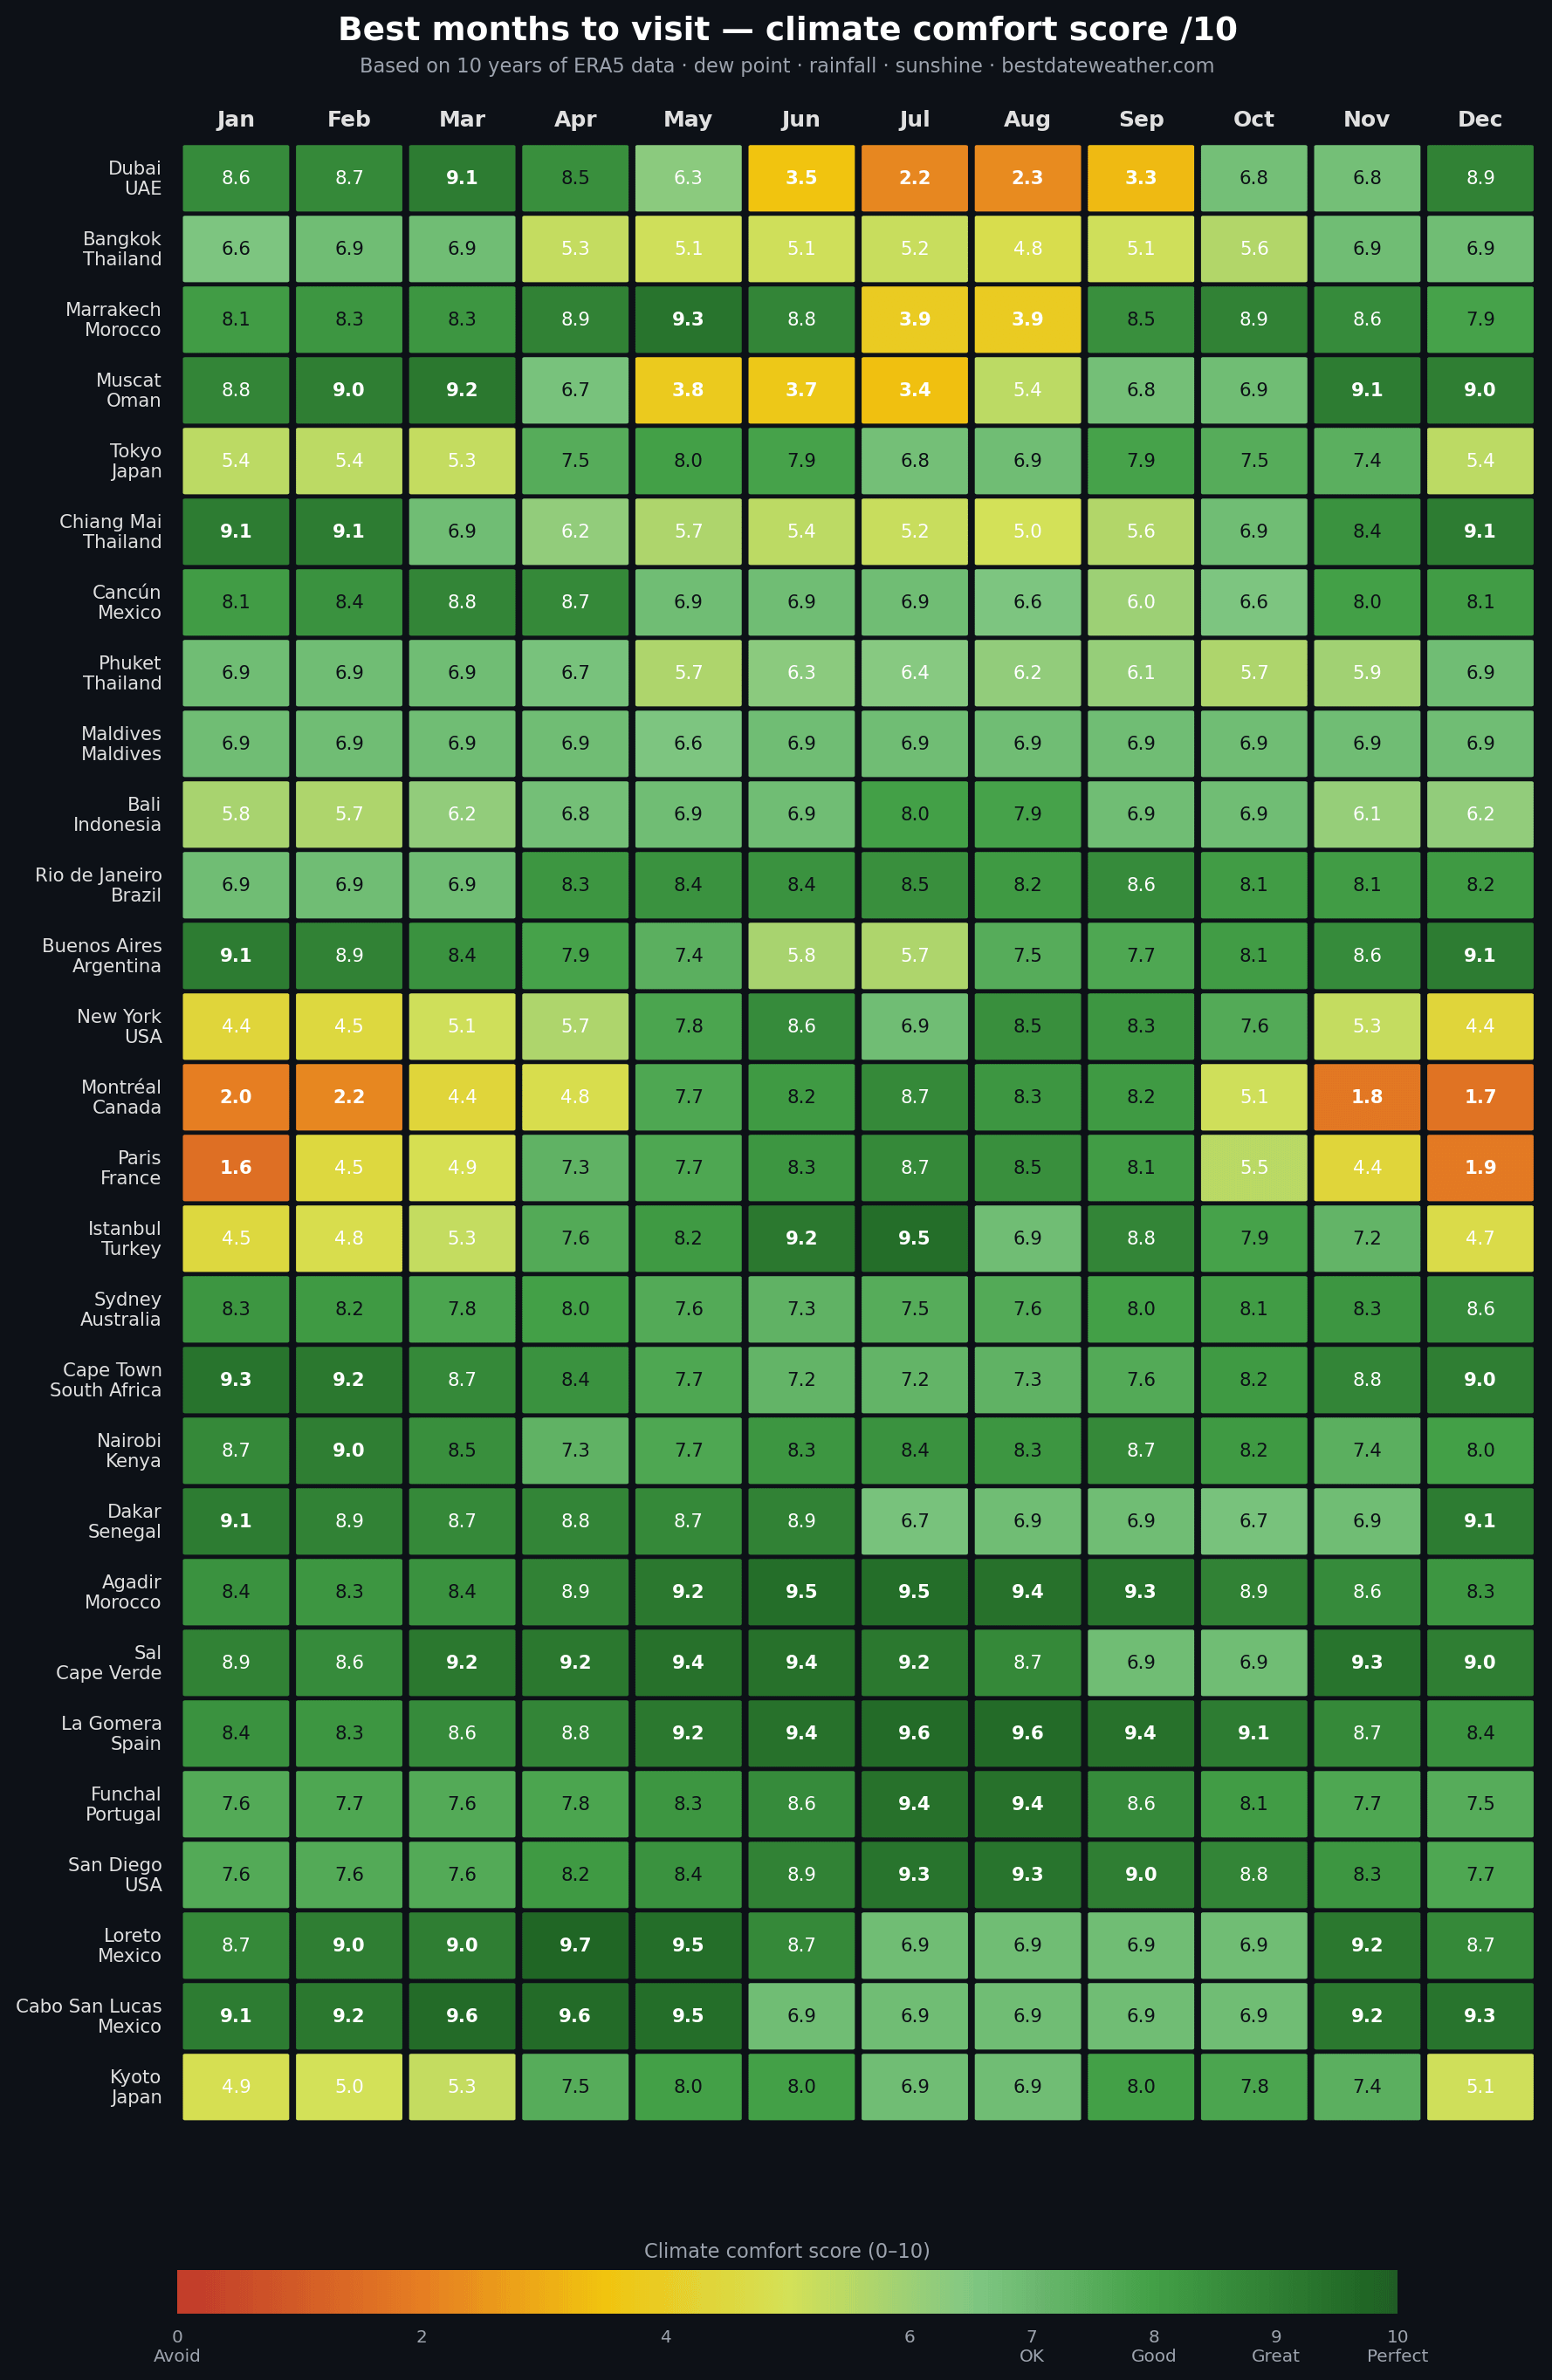
Each cell is a composite score 0-10 combining temperature comfort, rainfall, sunshine hours and dew point. If you saw a similar chart from me a few weeks ago, this is an updated version with a better humidity model.
The score follows the Tourism Climate Index (Mieczkowski 1985), the standard framework in travel climatology. It reflects average human thermal comfort, not personal preference. If you prefer cold weather the scores will feel off, that's expected.
Humidity is factored in through dew point. Dubai in July is 2.2. Tokyo in July is 6.8 because the dew point there peaks around 17C, below the heavy discomfort threshold.
Default mode is general travel comfort. The site also has beach, ski and digital nomad scoring, each with different weights.
39 destinations sorted A-Z. All 700 on https://bestdateweather.com/
Drop a city in the comments.
Data: ERA5 via Open-Meteo (2015-2024) / Python, pandas, matplotlib
Posted by Witty-Message97
3 Comments
Might have been interesting to see it sorted by latitude.
How does Paris becomes so « uncomfortable » during winter ?
Cool site. It would be nice to be able to say your preferred temperature for personalized scores.
I didn’t notice the option to switch languages at first, and the auto translation gave me some interesting results…
https://preview.redd.it/kyyxdtg4tdvg1.jpeg?width=586&format=pjpg&auto=webp&s=8c59a08cb3eb02cde3a8312745c8f0373d4a8c08