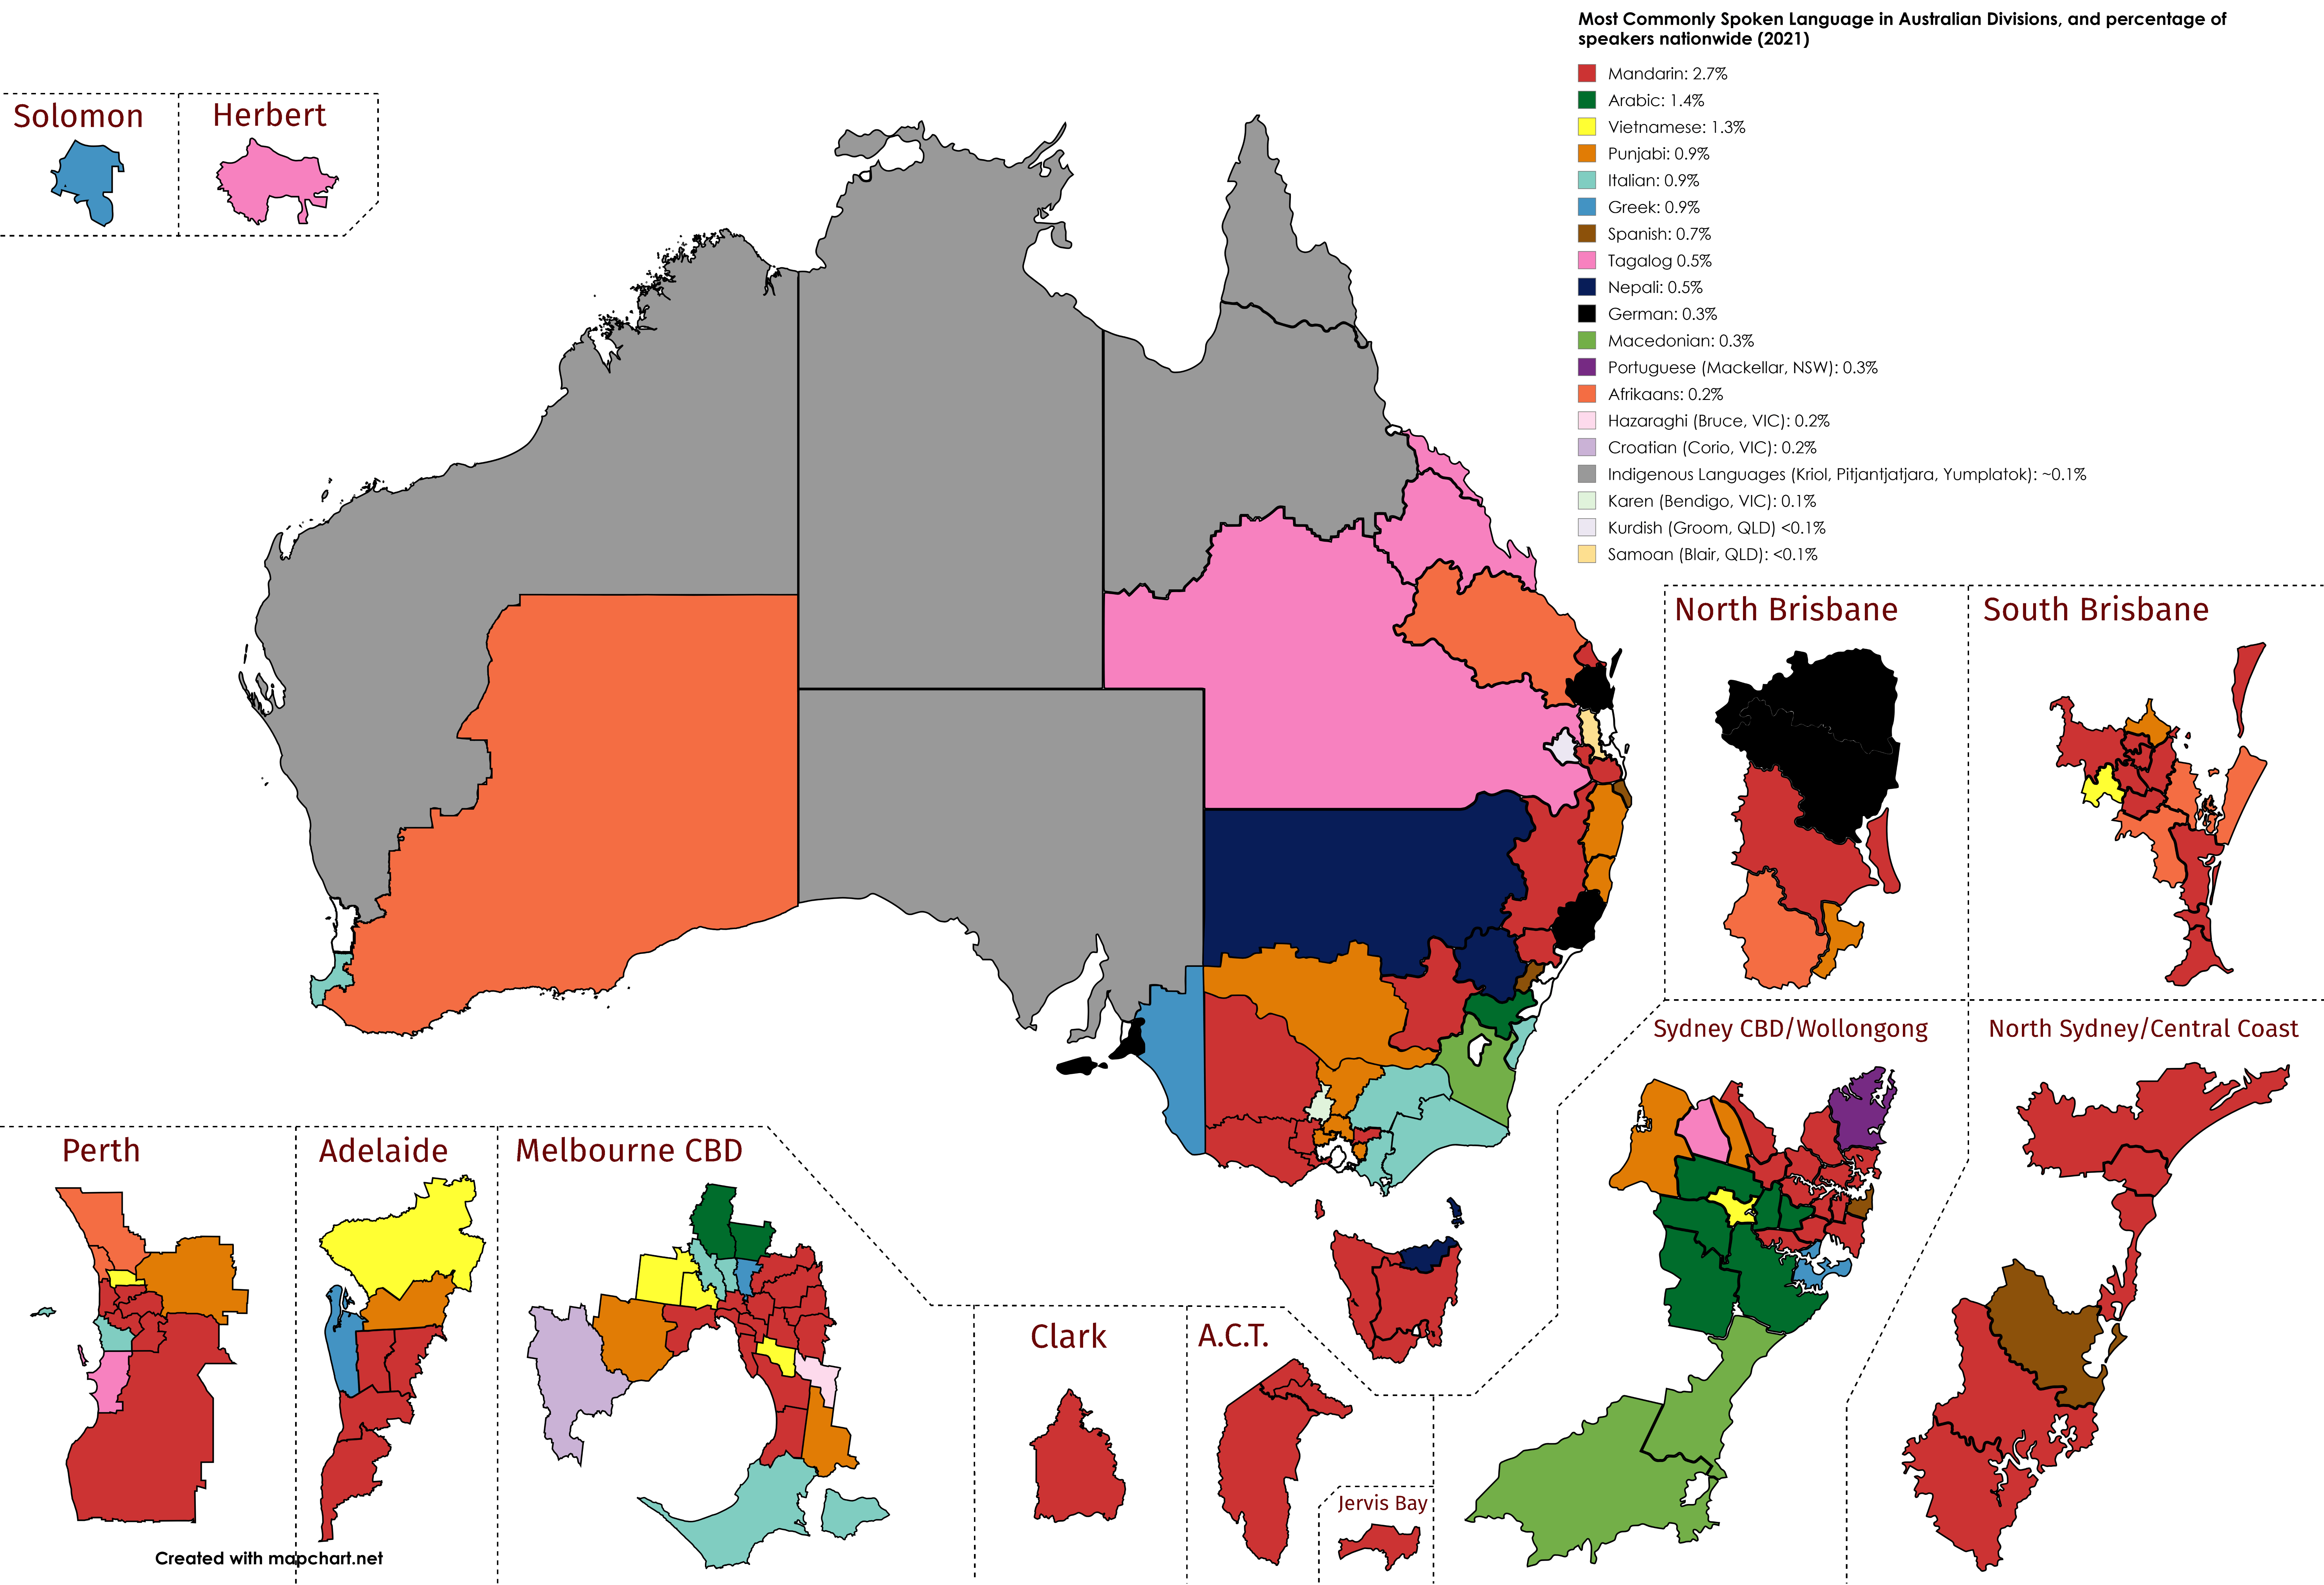
Most Commonly Spoke Language at Home in Australian Divisions, and percentage of nationwide speakers, (ABS Census, 2021)
Posted by Sqwoopy

")
Most Commonly Spoke Language at Home in Australian Divisions, and percentage of nationwide speakers, (ABS Census, 2021)
Posted by Sqwoopy
20 Comments
Most spoken non English language
TIFO there is a language called Karen and this isn’t a swipe at Bendigo. That being said, this should be corrected to say “excluding English” because for a majority of these electorates that is the language spoken at home. I guess also it should be electorates and not divisions because these are based on federal government electorates as of the 2021 census
EDIT: Yes, this is supposed to be “Most spoken language other than English”. Many of these places had more than 50% of homes reporting English only spoken at home
english????
Oh nobody speaks in English there? Sad!
Find it hard to believe there are not Korean or Cantonese speakers.
Newcastle is not part of the Central Coast.
Zoom in to see the legend zoom out to see the map zoom in to see the legend zoom out to see the map . . .
Those numbers are miniscule. Succeeding generations don’t retain their ancestors’ languages as much, no?
This type of map doesn’t really work in Australia the same way it works elsewhere because immigrant communities are much more evenly spread across the country.
Really sad that “indigenous languages” adds up to that little
More Macedonian than Croatian, interesting. Are they refugees of the greek civil war as well as yugoslavian immigrants?
pretty wild to see how diverse australia really is
Where are the northern-end Central Coast Spanish speakers hiding?
I like how Rottnest Island (off Perth) has more Italian speakers than any other language.
(This is probably an aberration, I’m guessing it forms part of the Fremantle LGA, which is also Italian, but there are very few residents on Rottnest)
Interesting to see Punjabi above Hindi and a bunch of other Indian languages. I’m guessing it’s a recent change due to much higher migration from Punjabi speaking regions in India. Also, some (majority) of the Pakistani migrants are also Punjabi speakers.
Don’t let Pauline see
I was going to question Portuguese, but then I remembered Brazil.
Australia’s English requirements have really fallen off; our workforce isn’t set up for multiple languages in the workplace.
Adelaide surprises me, I would’ve guessed Vietnamese in the west, Greek in the inner west and Italians in the east but then I come from a time where we were all migrant kids together rather than these pitifully small numbers.