Find your next quality investment with Simply Wall St’s easy and powerful screener, trusted by over 7 million individual investors worldwide.
-
If you are wondering whether Carpenter Technology’s strong run still leaves value on the table, it helps to step back and look at what the recent share price is actually implying.
-
The stock recently closed at US$445.14, with returns of 4.0% over 7 days, 13.0% over 30 days, 31.6% year to date and 113.4% over 1 year, along with very large gains over 3 and 5 years.
-
Those moves have put Carpenter Technology squarely on many investors’ watchlists, especially as long term performance has been strong and the stock continues to be actively traded. Recent coverage has focused on what is already priced in and whether current levels still line up with business fundamentals.
-
Even so, Carpenter Technology currently has a value score of 1/6. It is therefore worth comparing traditional valuation checks with other approaches, and then looking at a more holistic way to think about value that comes at the end of this article.
Carpenter Technology scores just 1/6 on our valuation checks. See what other red flags we found in the full valuation breakdown.
Approach 1: Carpenter Technology Discounted Cash Flow (DCF) Analysis
A Discounted Cash Flow, or DCF, model takes estimates of a company’s future cash flows and discounts them back to today using a required rate of return. The goal is to arrive at an estimate of what the entire business could be worth per share right now based on those projected cash flows.
For Carpenter Technology, the model used is a 2 Stage Free Cash Flow to Equity approach. The latest twelve month free cash flow is reported at about $469.5 million. Analysts provide free cash flow estimates out to 2028, and Simply Wall St then extrapolates further, with projected free cash flow of $337.0 million in 2030 and discounted values set out for each year through 2035.
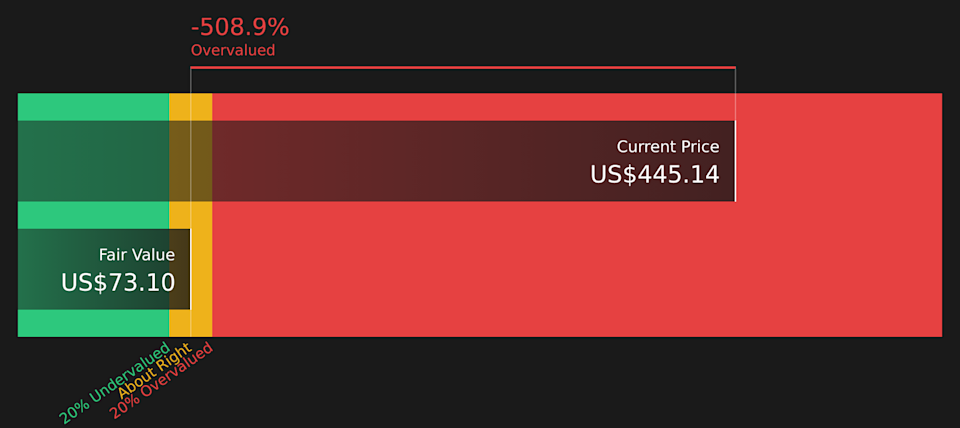
Putting these cash flow projections together, the DCF model suggests an estimated intrinsic value of about $73.10 per share. Compared with the recent share price of $445.14, this indicates the stock is trading at a much higher level than the value suggested by the cash flows used in the model, with an intrinsic discount suggesting it is roughly 5x above the DCF estimate.
Result: OVERVALUED
Our Discounted Cash Flow (DCF) analysis suggests Carpenter Technology may be overvalued by 508.9%. Discover 51 high quality undervalued stocks or create your own screener to find better value opportunities.
CRS Discounted Cash Flow as at May 2026
Head to the Valuation section of our Company Report for more details on how we arrive at this Fair Value for Carpenter Technology.
Approach 2: Carpenter Technology Price vs Earnings
For a profitable company, the P/E ratio is a useful way to gauge how much you are paying for each dollar of earnings. A higher P/E often reflects stronger growth expectations or lower perceived risk, while a lower P/E can point to more muted growth expectations or higher perceived risk.
Carpenter Technology currently trades on a P/E of 46.18x. That sits above the Aerospace & Defense industry average P/E of 36.92x and is below the average of its selected peers at 50.82x. On its own, this mix of comparisons does not clearly tell you what the stock should be worth because each peer and industry constituent has different growth, margin and risk profiles.
To address this, Simply Wall St uses a “Fair Ratio” for the P/E, which is 37.44x for Carpenter Technology. This is a proprietary estimate of what the P/E might be given the company’s earnings growth profile, industry, profit margins, market cap and risk factors. Because it adjusts for these elements in one figure, it can be more informative than a simple comparison with peers or the broad industry.
With a current P/E of 46.18x versus a Fair Ratio of 37.44x, the stock is screening as expensive on this metric.
Result: OVERVALUED
NYSE:CRS P/E Ratio as at May 2026
P/E ratios tell one story, but what if the real opportunity lies elsewhere? Start investing in legacies, not executives. Discover our 18 top founder-led companies.
Upgrade Your Decision Making: Choose your Carpenter Technology Narrative
Earlier we mentioned that there is an even better way to understand valuation. Narratives on Simply Wall St let you connect your view of Carpenter Technology’s story with your own numbers by turning your assumptions about future revenue, earnings, margins and fair value into a clear forecast that is easy to compare with the current share price. Because these Narratives sit in the Community page and update when new information like earnings or news arrives, you can see, for example, how one investor might build a more optimistic Narrative closer to the US$495.00 upper analyst price target while another builds a more cautious Narrative nearer the US$375.00 lower target. You can then use those fair value estimates next to today’s market price to help decide whether the stock looks closer to a buy, a hold or a sell for your own approach.
Do you think there’s more to the story for Carpenter Technology? Head over to our Community to see what others are saying!
NYSE:CRS 1-Year Stock Price Chart
This article by Simply Wall St is general in nature. We provide commentary based on historical data and analyst forecasts only using an unbiased methodology and our articles are not intended to be financial advice. It does not constitute a recommendation to buy or sell any stock, and does not take account of your objectives, or your financial situation. We aim to bring you long-term focused analysis driven by fundamental data. Note that our analysis may not factor in the latest price-sensitive company announcements or qualitative material. Simply Wall St has no position in any stocks mentioned.
Companies discussed in this article include CRS.
Have feedback on this article? Concerned about the content? Get in touch with us directly. Alternatively, email editorial-team@simplywallst.com

 After Its 113% One Year Surge?")