
![[OC] Co-citation network of 6,612 Supreme Court of Canada cases and 96,017 co-citations, coloured by computer-detected areas of law](https://www.byteseu.com/wp-content/uploads/2026/06/zn993s8nb55h1-1024x626.png "[OC] Co-citation network of 6,612 Supreme Court of Canada cases and 96,017 co-citations, coloured by computer-detected areas of law")
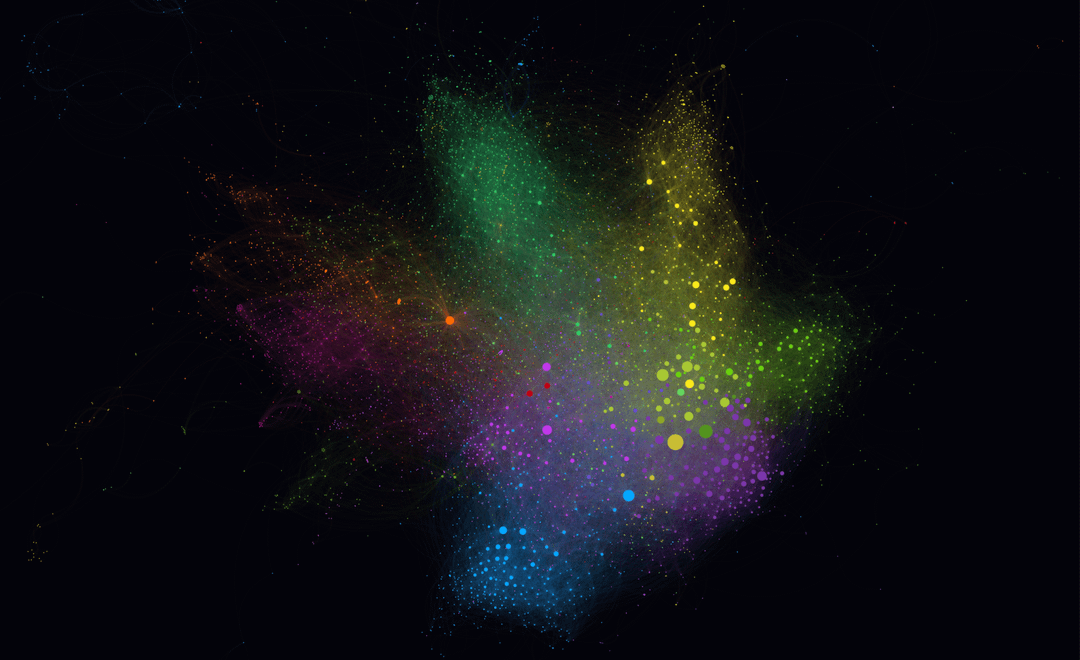
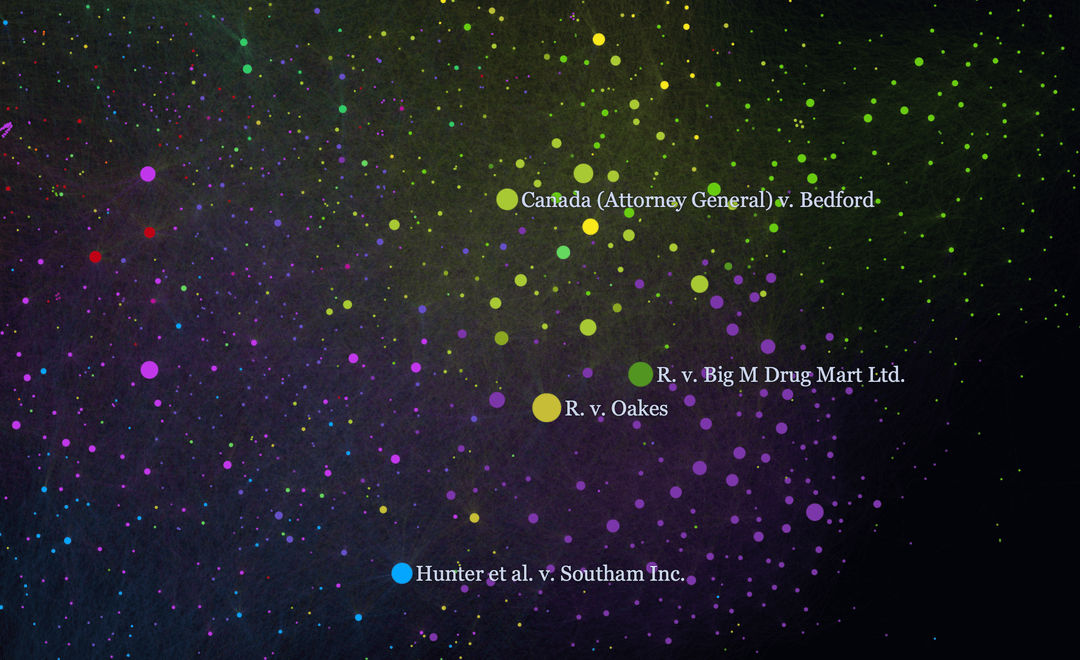
Every dot is a Supreme Court of Canada case. Every curved line connects two cases that were cited together in a later decision. The more often they're co-cited, the thicker the line.
Coloured clusters are Louvain communities of densely connected cases. They appear to roughly correspond with different areas of law (constitutional, criminal, property, etc.). Node size reflects authority score, calculated using the HITS algorithm. Google used HITS at one point to rank websites.
The layout was generated in Gephi using ForceAtlas2. Nodes repel each other, co-citations pull related cases together. What emerges looks like a galaxy.
The interactive version is at caselawatlas.com. You can click any node to see information about the case, and search by name or citation.
[OC] | Data: A2AJ project (a2aj.ca) | Tools: Gephi (layout + community detection), Sigma.js + Graphology (web rendering), Claude (development)
Posted by thescarfhold
4 Comments
The site is very slow for me, but looks very cool
Finally, some actually beautiful data.
Wow this is really beautiful. The fact that 200 years of legal precedent self-organizes into something that looks like a nebula is kind of mind-blowing. You can almost see where criminal law bleeds into constitutional stuff just from the color clusters. I’m absolutely going to lose hours on that interactive version!
I don’t quite get the way it is represented but it sure fits in to r/dataisbeautiful because it truly is beautiful, it reminds me of a galaxy.