
![[OC] Interactive MAANG Stock Dashboard - candlestick, pivot tables & multi-company comparison](https://www.byteseu.com/wp-content/uploads/2026/06/f8b6fk4har5h1-1536x810.gif "[OC] Interactive MAANG Stock Dashboard – candlestick, pivot tables & multi-company comparison")
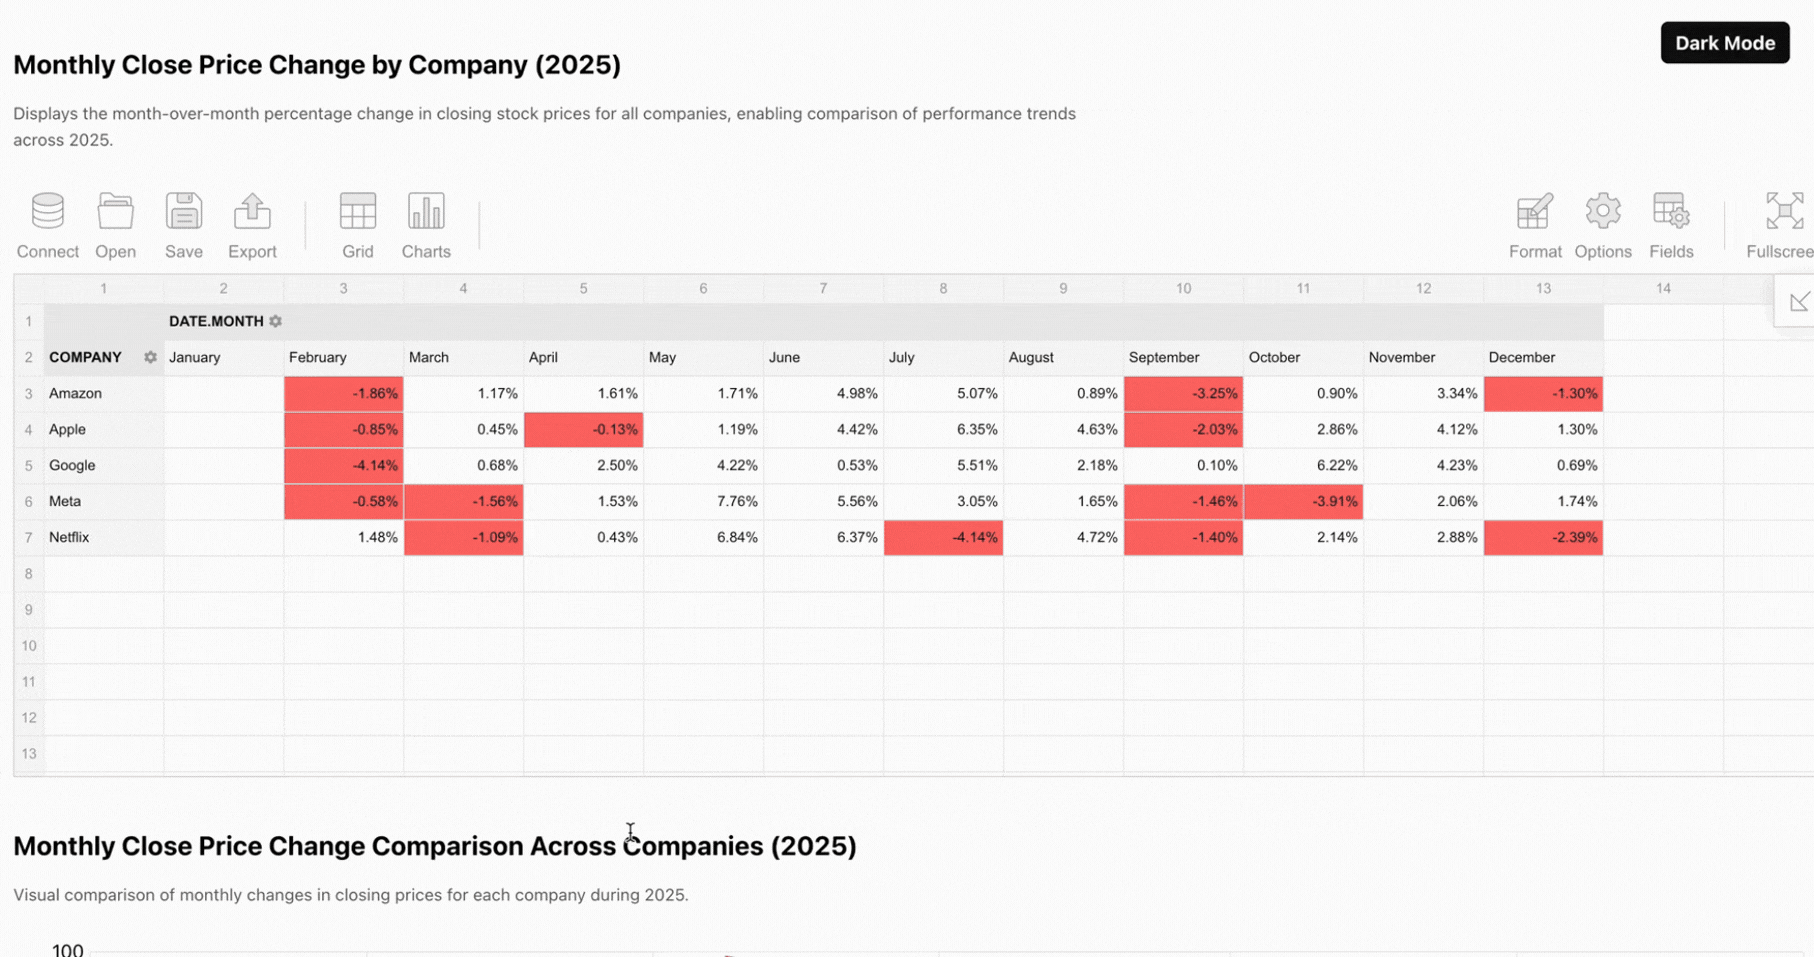
Tracked monthly OHLC data for Apple, Amazon, Google, Meta, and Netflix throughout 2025 and built a dashboard to explore it from a few different angles.
Includes a candlestick chart per company, a month-over-month close price comparison across all five, pivot tables with conditional formatting that highlights negative months, and a combo chart pairing trading volume with closing price.
Data source: MAANG-Stock-DATASET on Kaggle
Tools: React, amCharts, Flexmonster
Posted by Infamous_Return2657