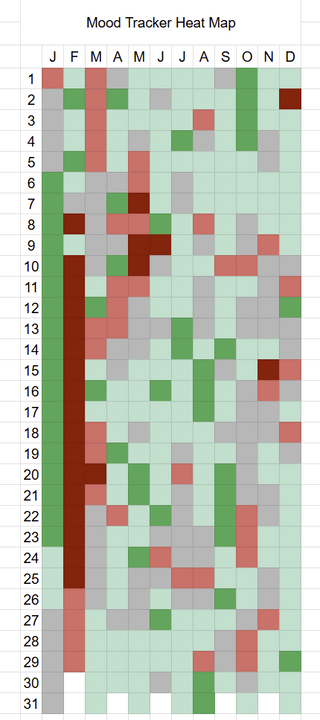
Seems like January was great and then something bad suddenly happened in February..then the rest of the year was generally okay, but no trend one way or another.
TheFeshy on
That turn from January to February was rough.
zosolm on
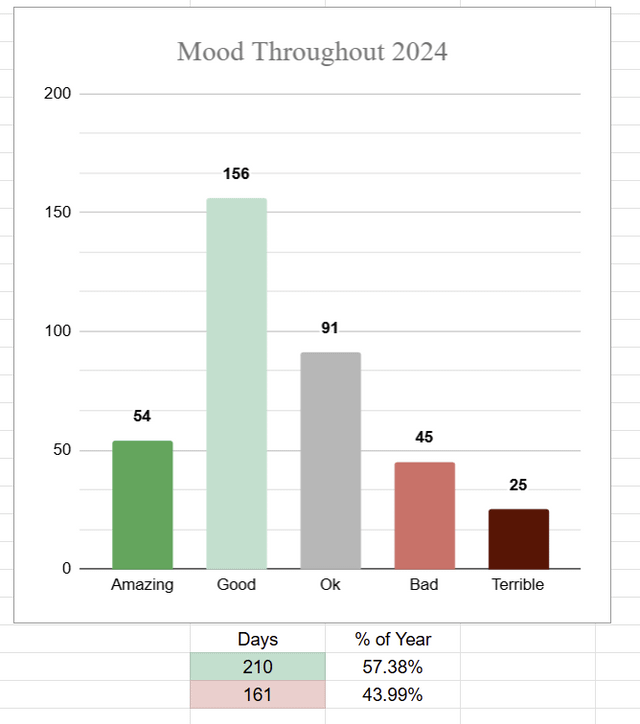
The second photo shows 210 green and 161 red days, totalling 371 days in 2024. Did I miss something?
MadoneOnMobile on
February 8th dog died, February 9th came back to life February 10th died again
beast_status on
He met a girl in january. He thought it was real but it was just a revenge fling and she moved back in with her BF a few weeks later after making up.
Coital_Conundrum on
Im not a fan of February either. It’s the Tuesday of the year.
georgi16 on
Guess vday and cinco de mayo are not your most fav holidays. lol. Great data! Cool to see
chesterT3 on
Can you share the template you created? I think I’d like to do this. Also, your February was my March.
DarthMaulATAT on
I’ve been using a mood tracker app like this for the last 5 years. I highly recommend it. Mine also lets me use it as a journal and add pictures and symbols too. Pixel Year on the play store for anyone interested.
oversoul00 on
I’ve never really understood these. Wouldn’t your mood influence the scoring via a compounding effect?
I suppose a simple good vs bad mood would work fine but wouldn’t there be wild swings where good moods cause higher scores than might be objectively true? Sort of how you might rate a mediocre movie higher because you were in a good mood when you saw it. In this case it’s self referential.
I just imagine having a mini existential crisis if I were to score myself, not trying to rain on your parade.
SonicContinuum88 on
This is awesome OP, I’ve done something almost identical for the last few years, tracking mood along with a few other facets that impact my well being. It really helps me identify baselines and trends. So fun having a year’s worth of data to analyze at the end!
DigitalFStop on
Damn January really tricked ya into thinking it was gonna be a good year, then February came in swinging
superflick_x on
I did this too but I’ve not managed to put it in to a table yet – yours looks great! I had to granulate mine down into many more options 😂
Cambronian717 on
Came out the gate booking it and then crashed in February. Never quite recovered
tfhaenodreirst on
Love it!!! I don’t know what I would track on it but I love the design of the first one.
ILooked on
My mood is the same every day.
mauledbybear on
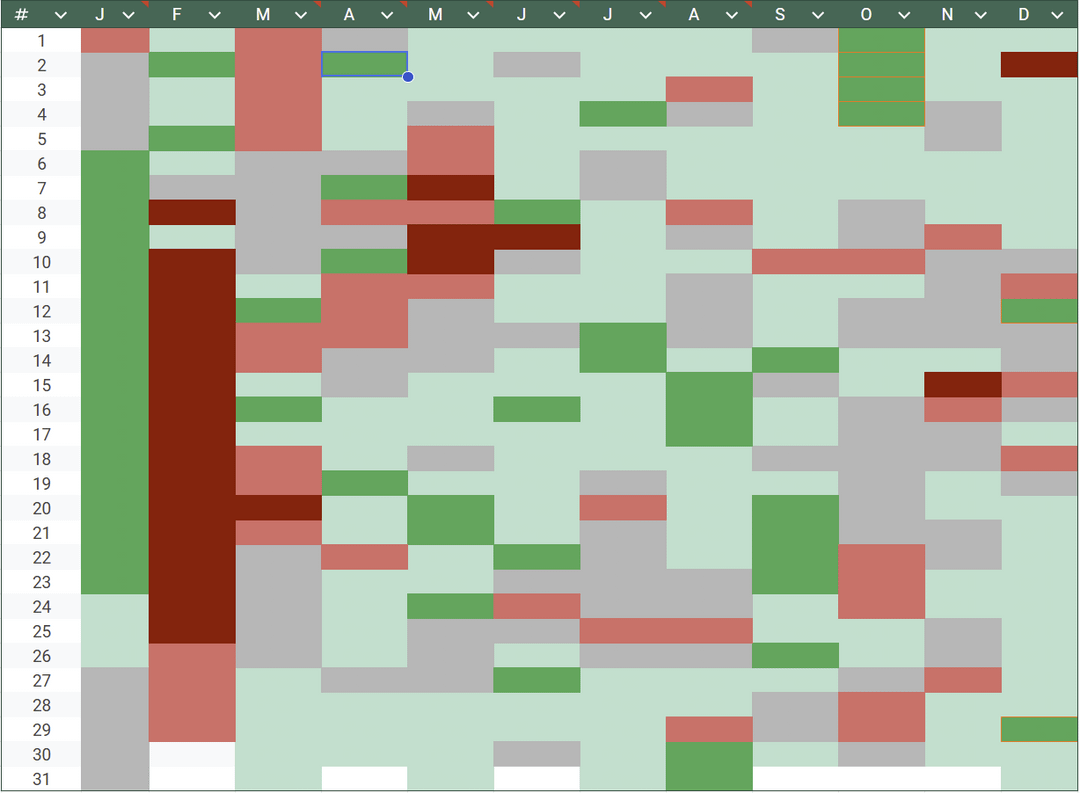
What’s the difference between the first and last slides? Probably something obvious I’m overlooking.
YoanSchreck on
Glad you had a good day today
asicarii on
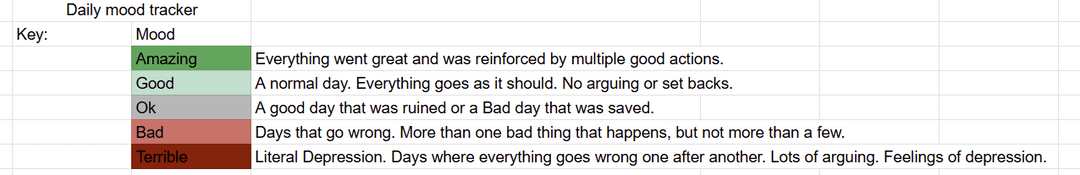
Anyone else consider an OK day a positive day?
Litete_Revived on
bro was pissed throughout all of valentine’s day season lmao (sorry if any personal shit happened during this time)
freebaba2015 on
color blind and can’t distinguish between the good and bad mood colors
capitan_stein on
lol imagine going out of your way and doing this. could you be any more lame, please?
ThatsKindaHotNGL on
The contrast between January and February is insane
lurkandload on
I’m an idiot.. I was like “who hates Fridays?”
finiteresource on
Nice work!
yerguyses on
Cool! I’ve done similar. My depression is mainly behavioral, that is lack of activity, lying in bed all the time. But at the same time my mood may be fine. So I divided my chart in to two parts: mood and activity level.

28 Comments
What happened February 10th-29th?
Cool. Did you make the graph afterwards?
What’s the story that goes with the data?
Seems like January was great and then something bad suddenly happened in February..then the rest of the year was generally okay, but no trend one way or another.
That turn from January to February was rough.
The second photo shows 210 green and 161 red days, totalling 371 days in 2024. Did I miss something?
February 8th dog died, February 9th came back to life February 10th died again
He met a girl in january. He thought it was real but it was just a revenge fling and she moved back in with her BF a few weeks later after making up.
Im not a fan of February either. It’s the Tuesday of the year.
Guess vday and cinco de mayo are not your most fav holidays. lol. Great data! Cool to see
Can you share the template you created? I think I’d like to do this. Also, your February was my March.
I’ve been using a mood tracker app like this for the last 5 years. I highly recommend it. Mine also lets me use it as a journal and add pictures and symbols too. Pixel Year on the play store for anyone interested.
I’ve never really understood these. Wouldn’t your mood influence the scoring via a compounding effect?
I suppose a simple good vs bad mood would work fine but wouldn’t there be wild swings where good moods cause higher scores than might be objectively true? Sort of how you might rate a mediocre movie higher because you were in a good mood when you saw it. In this case it’s self referential.
I just imagine having a mini existential crisis if I were to score myself, not trying to rain on your parade.
This is awesome OP, I’ve done something almost identical for the last few years, tracking mood along with a few other facets that impact my well being. It really helps me identify baselines and trends. So fun having a year’s worth of data to analyze at the end!
Damn January really tricked ya into thinking it was gonna be a good year, then February came in swinging
I did this too but I’ve not managed to put it in to a table yet – yours looks great! I had to granulate mine down into many more options 😂
Came out the gate booking it and then crashed in February. Never quite recovered
Love it!!! I don’t know what I would track on it but I love the design of the first one.
My mood is the same every day.
What’s the difference between the first and last slides? Probably something obvious I’m overlooking.
Glad you had a good day today
Anyone else consider an OK day a positive day?
bro was pissed throughout all of valentine’s day season lmao (sorry if any personal shit happened during this time)
color blind and can’t distinguish between the good and bad mood colors
lol imagine going out of your way and doing this. could you be any more lame, please?
The contrast between January and February is insane
I’m an idiot.. I was like “who hates Fridays?”
Nice work!
Cool! I’ve done similar. My depression is mainly behavioral, that is lack of activity, lying in bed all the time. But at the same time my mood may be fine. So I divided my chart in to two parts: mood and activity level.