Source: my subjective evaluation of each day
Made using Google Sheets
FBrandt on
Sorry for what happened on Jun 14th.
McGondy on
I’d love to see days of the week in there – are Mondays good and Thursdays bad?
commanderclif on
Soooo glad you were able to have a nice November the 5th. Mine sucked.
ITisAllme on
A person who actually uses average as average, love to see it
ConundrumBum on
Tell papa bear what happened on June 14th so I can make sure it never happens to you ever again.
Sil369 on
Looks like a rate-my-crazy-class-schedule-this-semester post lol
ackudragon on
2024 was a shitty year overall. December 30 was the worst day I can remember. In 2025 I’m going to do this chart! The odds are it will be a better year overall. Thanks for sharing
cragglerock93 on
Yours sticks put as unusual to me as normally when people are tracking things like this, it’s a sort of show off, like they’ll have lots of green and they’ll tell us how those are explained by their promotion, engagement and holiday to Australia.
Calm_Station_3915 on
You’d probably like the app Daylio.
-Joel-and-Ellie- on
A very bad day followed by an average day makes me think the previous day wasn’t that bad
ForceBlade on
Why is every single person apparently doing these? I wonder if we’re gotten any fakes yet.
Eyeofthebear on
What are the metrics you used to evaluate a day? I imagine they would change as you age. 90+ years “I woke up…” seems like a good day.
Thanks for sharing.
Joeoens on
Bad news: Your year was below average. Good news: Your average just dropped, so next year will probably be better!
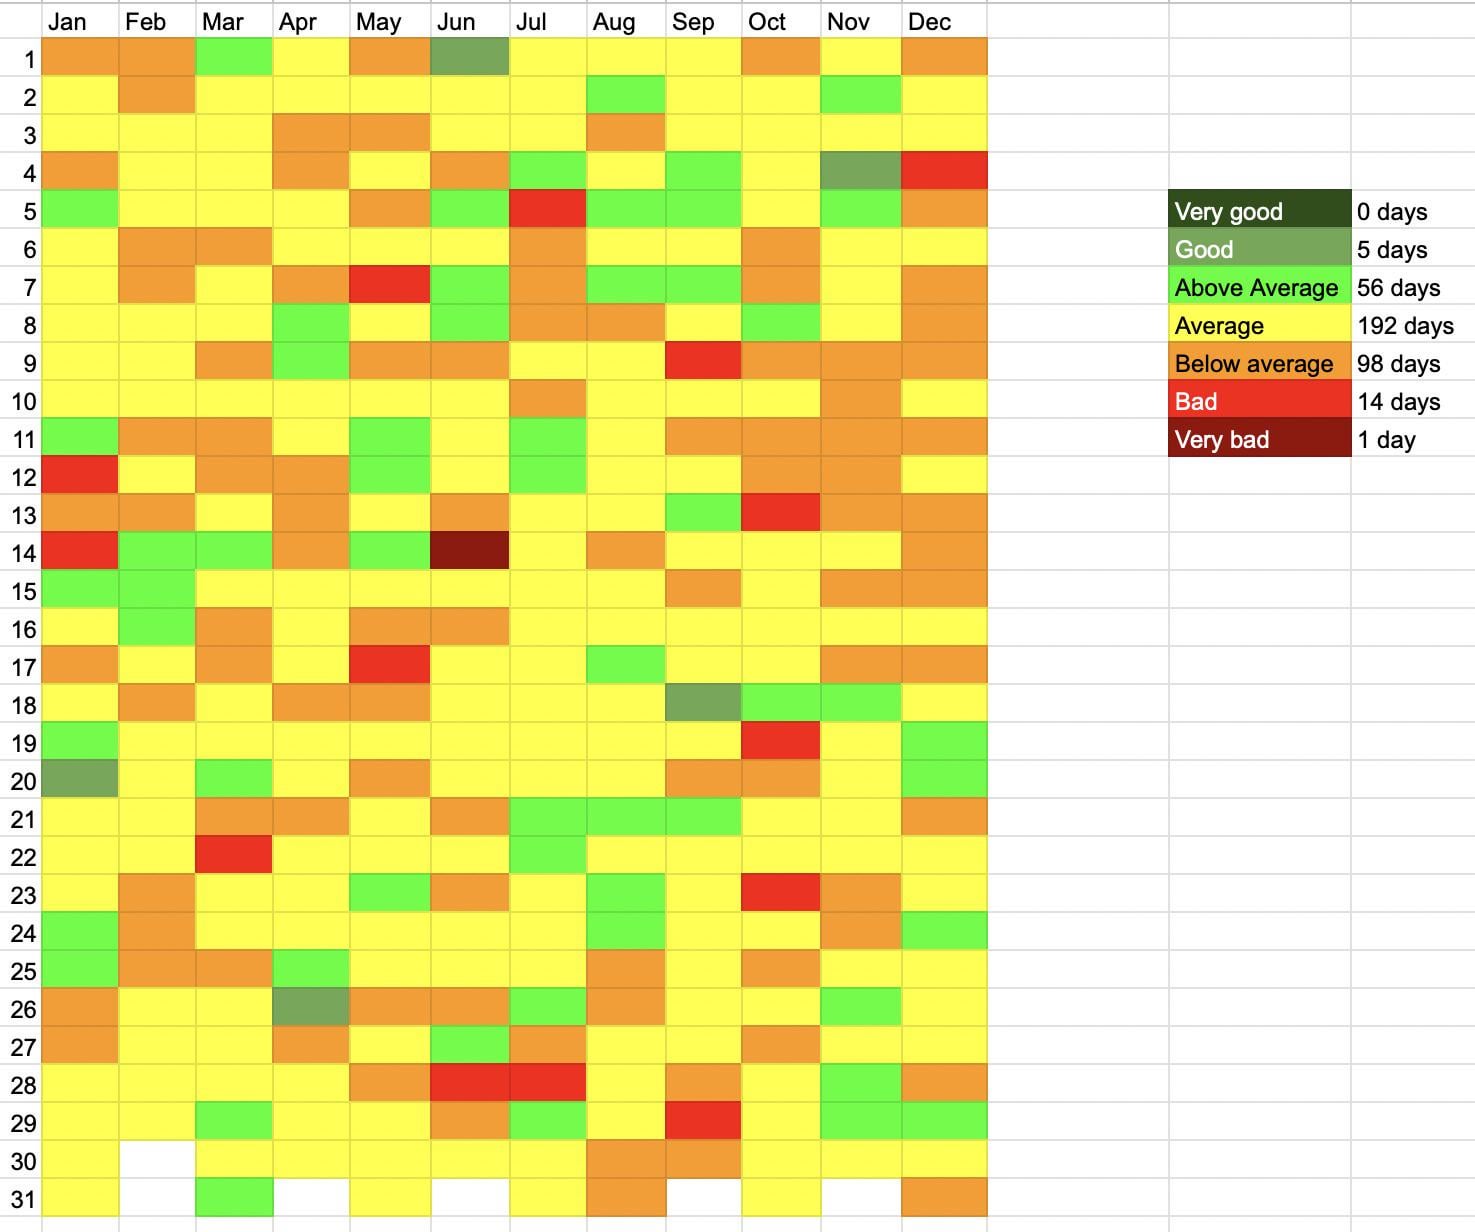

![[OC] How I rated each of my days in 2024](https://www.byteseu.com/wp-content/uploads/2025/01/mwq8uu0tmbae1-1024x855.jpeg "[OC] How I rated each of my days in 2024")
14 Comments
Source: my subjective evaluation of each day
Made using Google Sheets
Sorry for what happened on Jun 14th.
I’d love to see days of the week in there – are Mondays good and Thursdays bad?
Soooo glad you were able to have a nice November the 5th. Mine sucked.
A person who actually uses average as average, love to see it
Tell papa bear what happened on June 14th so I can make sure it never happens to you ever again.
Looks like a rate-my-crazy-class-schedule-this-semester post lol
2024 was a shitty year overall. December 30 was the worst day I can remember. In 2025 I’m going to do this chart! The odds are it will be a better year overall. Thanks for sharing
Yours sticks put as unusual to me as normally when people are tracking things like this, it’s a sort of show off, like they’ll have lots of green and they’ll tell us how those are explained by their promotion, engagement and holiday to Australia.
You’d probably like the app Daylio.
A very bad day followed by an average day makes me think the previous day wasn’t that bad
Why is every single person apparently doing these? I wonder if we’re gotten any fakes yet.
What are the metrics you used to evaluate a day? I imagine they would change as you age. 90+ years “I woke up…” seems like a good day.
Thanks for sharing.
Bad news: Your year was below average. Good news: Your average just dropped, so next year will probably be better!