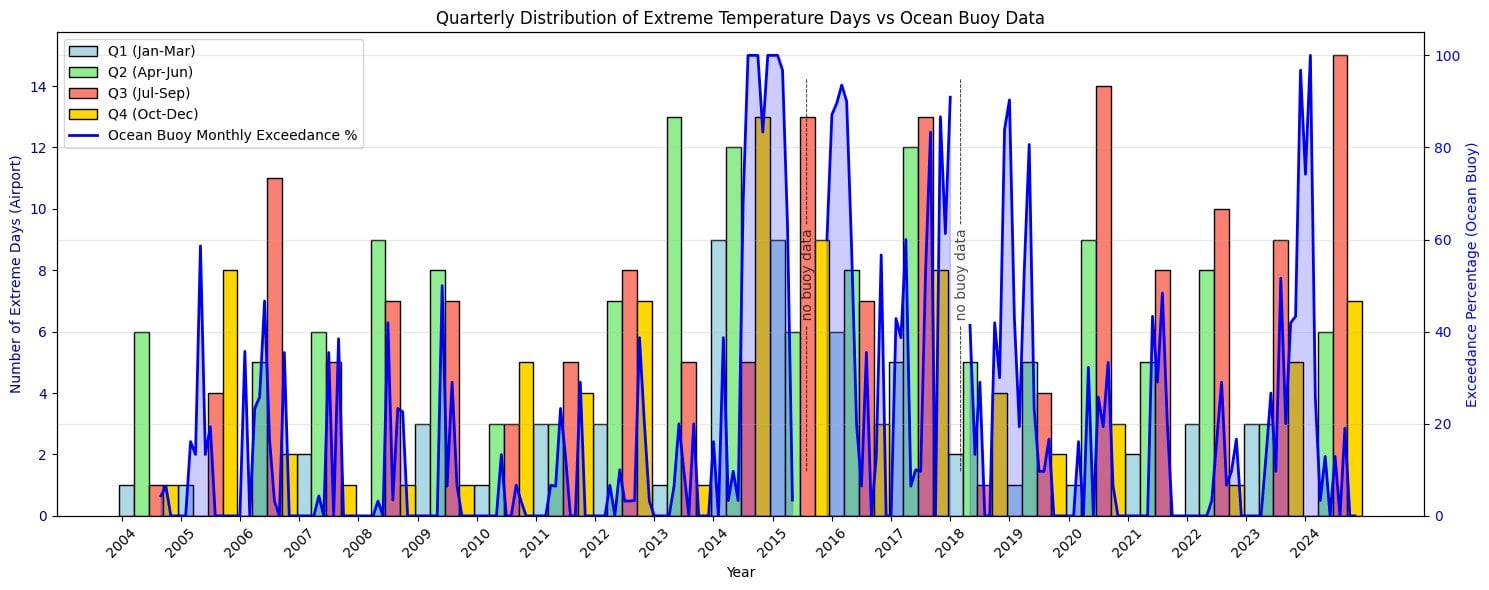
Quantifying the Hot Summer of 2024 in Livermore (Bay Area), CA compared to previous two decades [2004 – 2024]. [OC]
Posted by Same_Actuator8111

![Quantifying the Hot Summer of 2024 in Livermore (Bay Area), CA compared to previous two decades [2004 - 2024]. [OC]](https://www.byteseu.com/wp-content/uploads/2025/01/f3ByvhidvU1Kvde7DnBtFkBYnSYaj7-_E1nAfMwaxwU-1024x406.jpg "Quantifying the Hot Summer of 2024 in Livermore (Bay Area), CA compared to previous two decades [2004 – 2024]. [OC]")
Quantifying the Hot Summer of 2024 in Livermore (Bay Area), CA compared to previous two decades [2004 – 2024]. [OC]
Posted by Same_Actuator8111
1 Comment
Interesting but a little difficult to interpret. It’s not clear how the ocean buoy data are correlated, if at all.
What would it look like if instead of a vertical bar chart, you had the seasons on the y-axis (keeping years on the x-axis) and shaded the grid cells by number of extreme days, with the color bar along the bottom?