
![[OC] Racial Diversity of US Metro Areas](https://www.byteseu.com/wp-content/uploads/2025/01/zi1vmqdwhqee1-1536x1221.png "[OC] Racial Diversity of US Metro Areas")
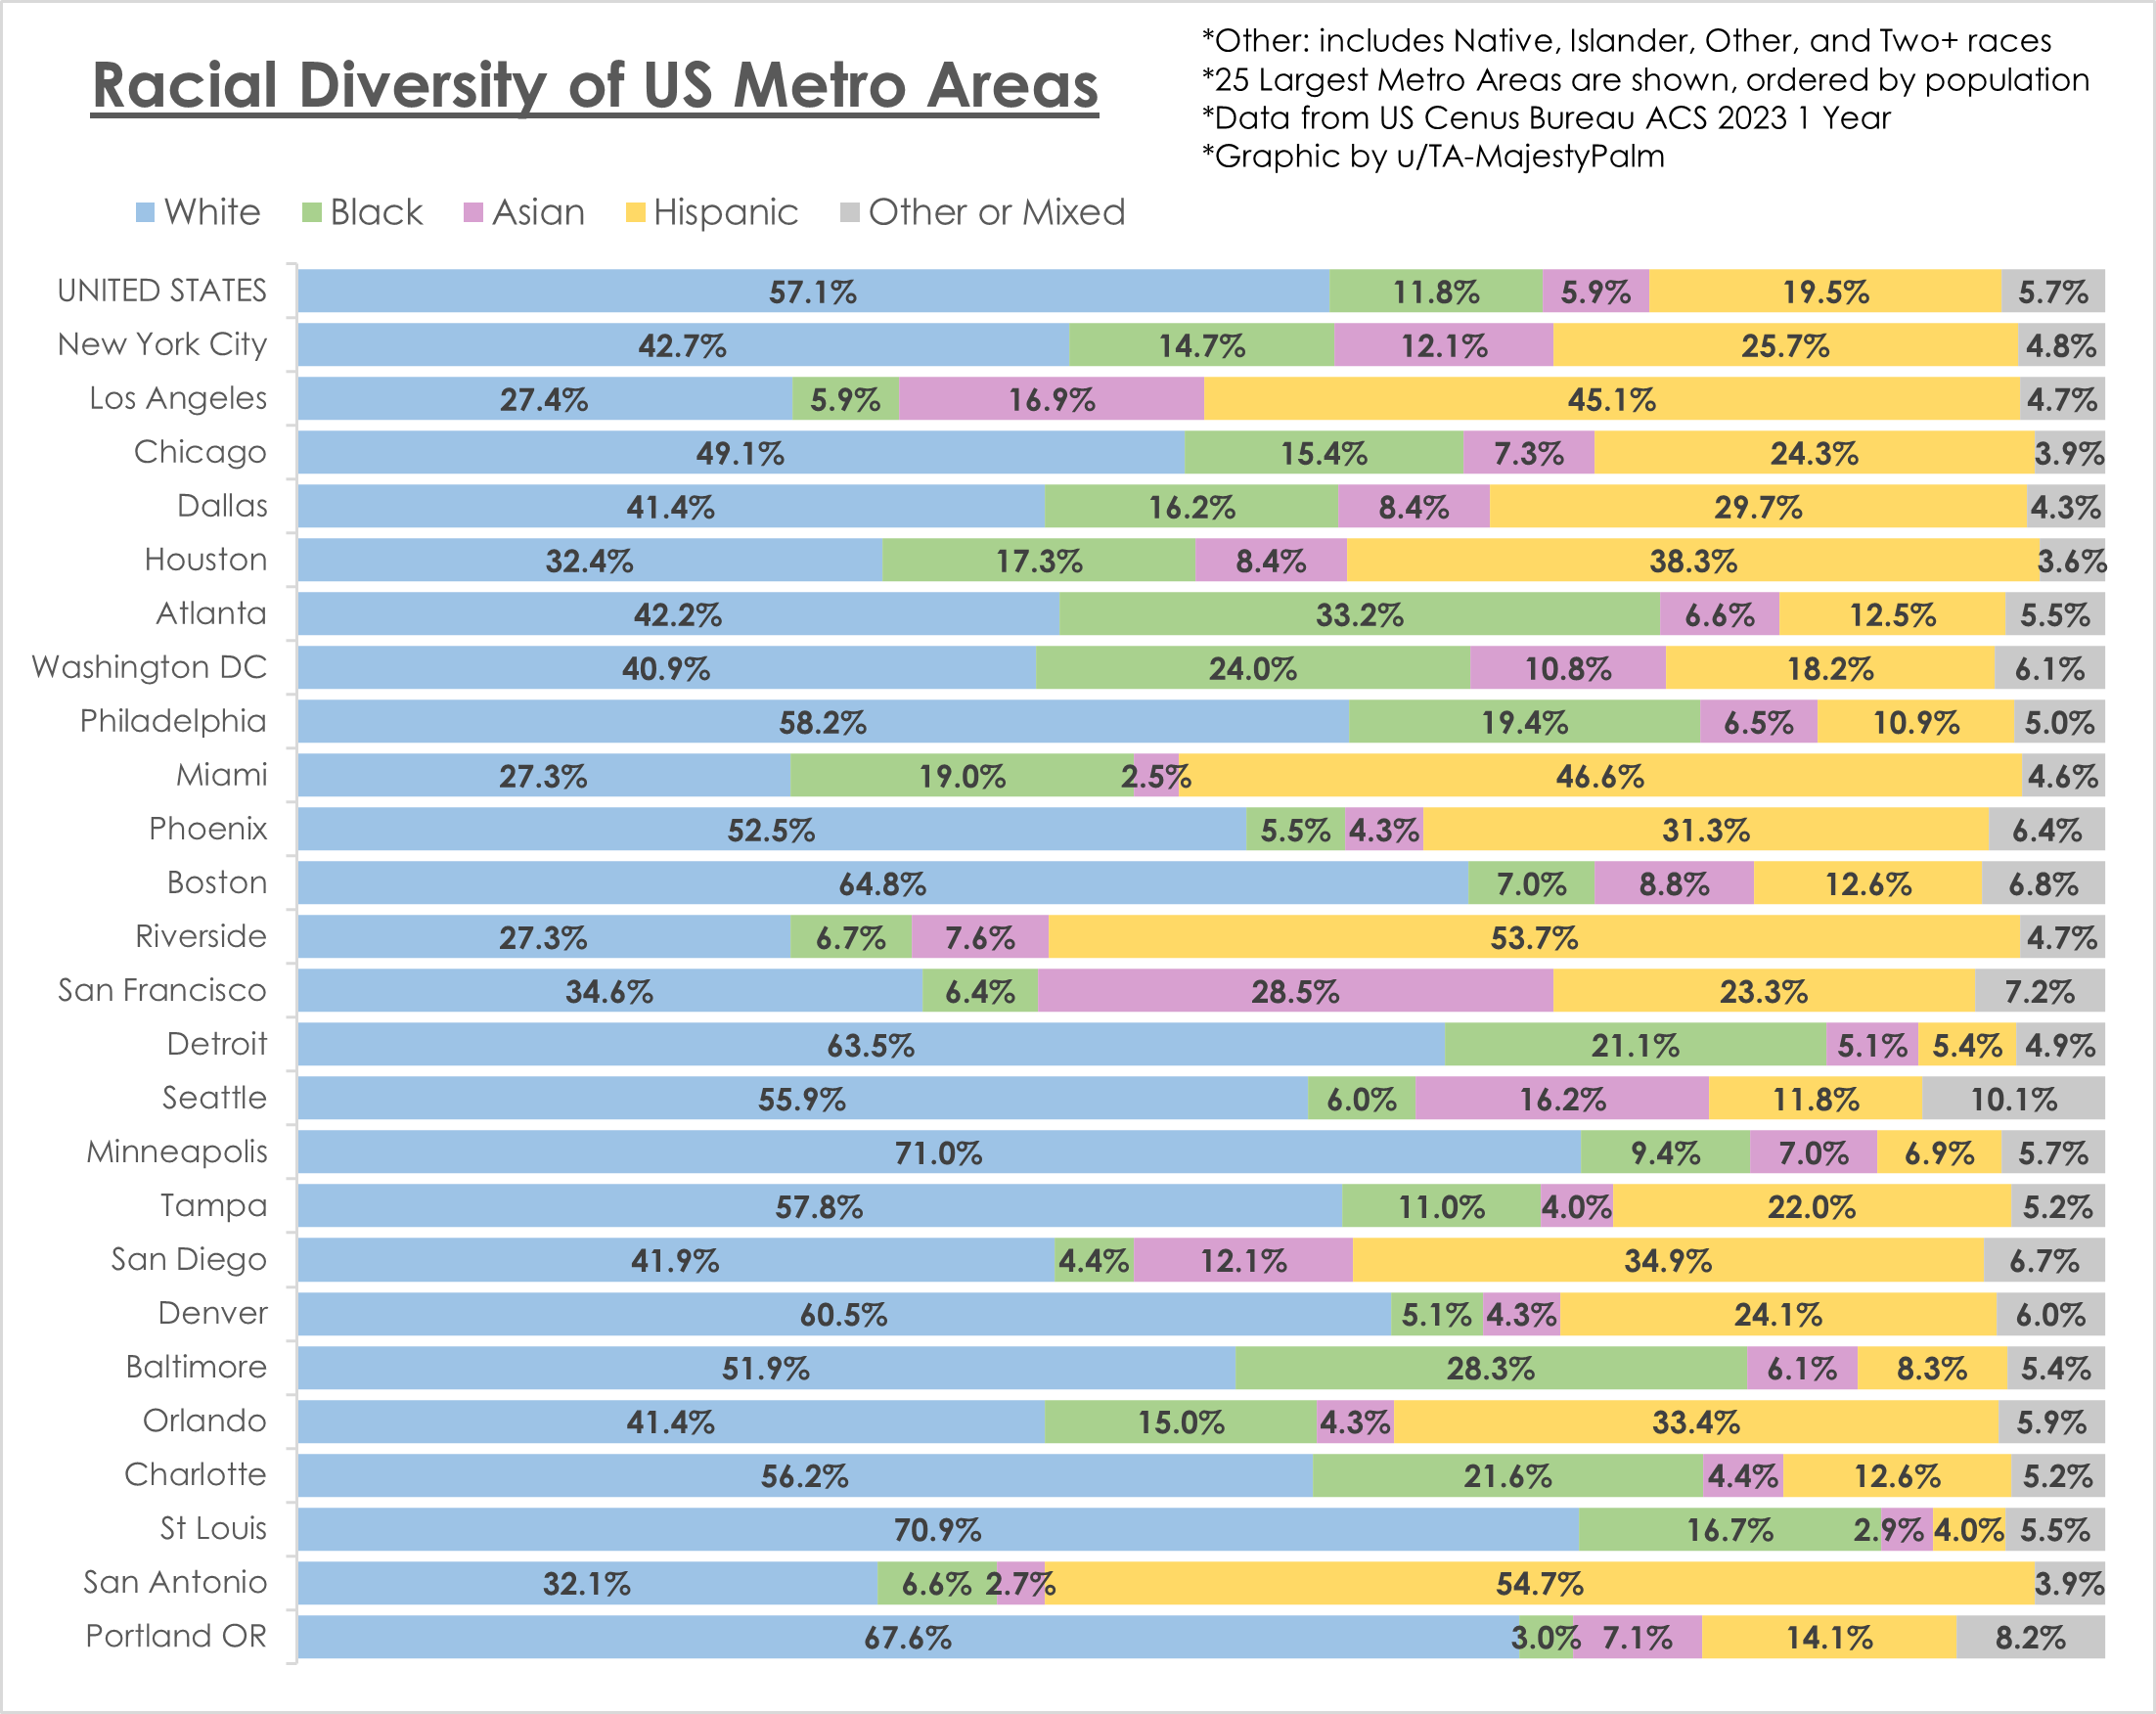
Graphic by me, created with excel using US Census data from each metro area here (example NYC Metro): https://censusreporter.org/profiles/31000US35620-new-york-newark-jersey-city-ny-nj-metro-area/
Some notes…
-
NYC and DC are the only two metros to have double digit percentages of the 4 main groups
-
Minneapolis is the only metro to have single digit percentages of all minority groups
-
The "other" category is almost entirely made up of mixed race, with native or islander being under 1% combined for most cities
-
"Hispanic" includes Hispanic of any race. For example you can select "Hispanic" and then also check white, black, or asian
-
All race data from the US Census is self-reported/identification
Posted by TA-MajestyPalm
2 Comments
Graphic by me, created with excel using US Census data from each metro area here (example NYC Metro): https://censusreporter.org/profiles/31000US35620-new-york-newark-jersey-city-ny-nj-metro-area/
Some notes…
– NYC and DC are the only two metros to have double digit percentages of the 4 main groups
– Minneapolis is the only metro to have single digit percentages of all minority groups
– The “other” category is almost entirely made up of mixed race, with native or islander being under 1% combined for most cities
– “Hispanic” includes Hispanic of any race. For example you can select “Hispanic” and then also check white, black, or asian
– All race data from the US Census is self-reported/identification
Riverside?? Is that a metro area I’m supposed to know about!?