Share Facebook Twitter LinkedIn Pinterest Bluesky Threads [OC] Number of Datasets on Data.gov since January 20th 2025 Posted by 7dayintern
-domi- on February 1, 2025 9:37 pm Start the y-axis at zero if you don’t want your graph to look like a politically-motivated attempt at misleading. This doesn’t depict the ~0.64% change very clearly (I’m not certain about the percentage, it’s not an easy graph to read).
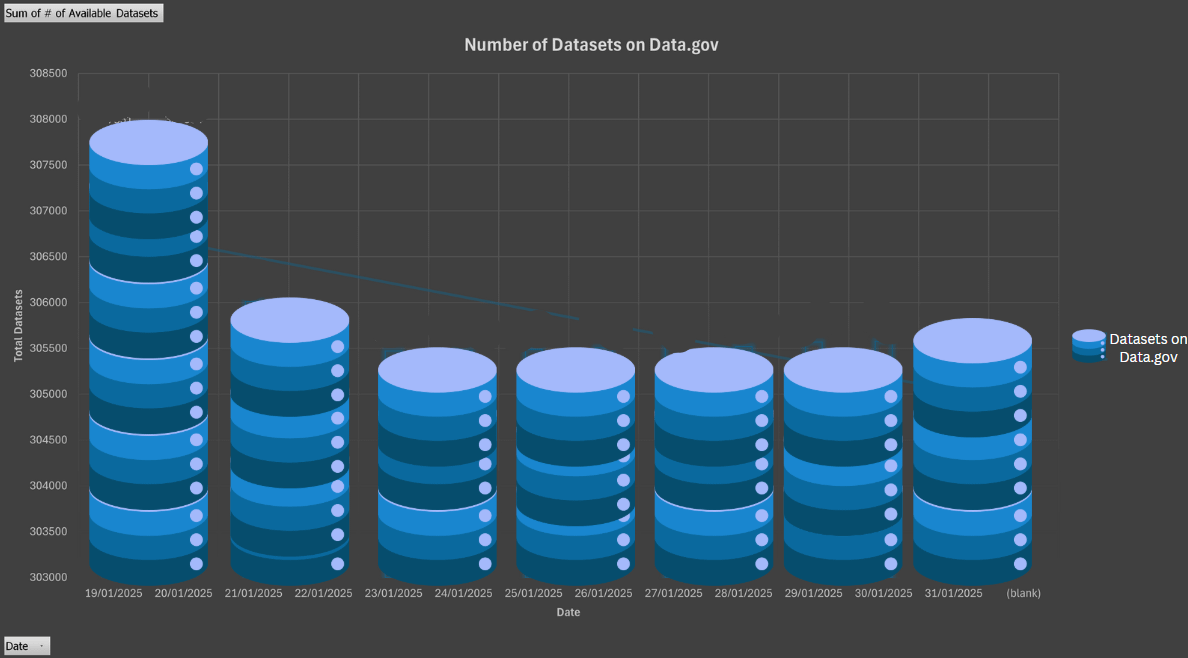

![[OC] Number of Datasets on Data.gov since January 20th 2025](https://www.byteseu.com/wp-content/uploads/2025/02/kflwres5elge1-1024x567.png "[OC] Number of Datasets on Data.gov since January 20th 2025")
2 Comments
Data from web archive wayback machine, visualized using excel
Start the y-axis at zero if you don’t want your graph to look like a politically-motivated attempt at misleading.
This doesn’t depict the ~0.64% change very clearly (I’m not certain about the percentage, it’s not an easy graph to read).