I posted a similar chart a few weeks ago and several people wanted see how federal employment compares to the US population. I chatted with some folks here and landed on using a similar measure: federal employment compared to the size of the entire US workforce.
Numerous_Recording87 on
Federal government workers per capita shows that there are about as few as there ever have been in the post-WWII era.
But Fox News told me the government is a massive wasteful juggernaut that keeps growing!
JackfruitCrazy51 on
A few things I find interesting:
Reagan ran on smaller government, but it only increased during his time. Maybe military? Just looked it up and during the 80’s about 75% of federal workers were military related. It’s now around 50%. Makes sense with the cold war ending.
Besides census years, it looks like it’s remained pretty steady at around 2.75 million, with a recent jump to 3 million.
skoltroll on
A funny thing happened in the early 40’s…
Soccer_Vader on
So, the federal governement is in-efficient because they have less man-power. Who would’ve thunk.
thestereo300 on
Does this include contractors? If not this is pointless.
Connathon on
needs to be lower. Lean and mean machine
fajfos on
I guess the Xgovernment will gladly do what your current govermant can’t. Democracy secured.
bareboneschicken on
Government employees are only part of the picture. Full-time government contractors exceed the number of civil service employees.
DivineAlmond on
US economy and free market is literally insane
in other countries this rate is like 10% usually, can go up to 25% in commie or regulated countries, and trump is cutting it even further
amazing sight to behold, be proud burgerians, this is unprecedented levels of success
beambot on
Meanwhile, US Government spending as a fraction of GDP keeps going up. If it’s not direct headcount costs, then it’s indirect. That would make this direct employment chart is disengenuous — it’s like Walmart saying “we have 1,000 employees, but we have 100,000 contractors.”
MorinOakenshield on
Need a graph separating military and including contractors
geek66 on
Plot against the R and Ds perception of what percentage.
IMO – any reasonable organization needs 5-10% overhead costs – running the county is no different.
tjkoala on
Its amazing how computers and automation have made people more efficient and in spite of that, if I want to provide documents to the IRS my options are to mail or fax a document.
Its not surprising the percentage has dropped, most government employees not in the postal service or military are white collar workers. We should see these jobs becoming more efficient, its just not efficient enough considering the technology available. Anyone who has delt with the IRS, Social Security Administration, Medicare/Medicaid, etc. knows exactly how inefficient, slow, bureaucratic, and backwards these agencies are compared to walking into literally any other business short of health insurance.
Disagree? Just try calling into the IRS or SSA and lmk how that goes.
deweywsu on
This is a pointless comparison. Government’s function has nothing to do with business.
YouLearnedNothing on
Holy hell 3 million people in the federal government alone?!?! I thought it was less than 2.. which is still crazy
NoBSforGma on
Doesn’t look so “bloated” after all, does it?
make_reddit_great on
*Christian Bale American psycho meme*
Very nice. Now include contractors and non-profits using federal grant money.
nemom on
A reporter asked the Hoover Dam Project Leader how many men he had working on site. He answered, “About a third of ’em.”
DeadFyre on
Meaningless. Over 10% of the Federal budget is spent on contractors, while employee salaries comprise around 7%. The actually important figure is *spending*, as a percentage of the entire U.S. economy, and relative to tax receipts.
So, what you’ll find is that in spite of “massive” tax cuts, the overall percentage of American GDP taken in taxes has remained reasonably steady at around 16% for the past 80 years. Meanwhile, government outlays as a percentage of GDP have climbed steadily higher, going from around 17% in the 1960’s to 23% today.
So the money we spend keeps going up, and the money we take in taxes remains stubbornly flat.
planko13 on
Where is all the money going then? Inflation adjusted expenditures looks very different.
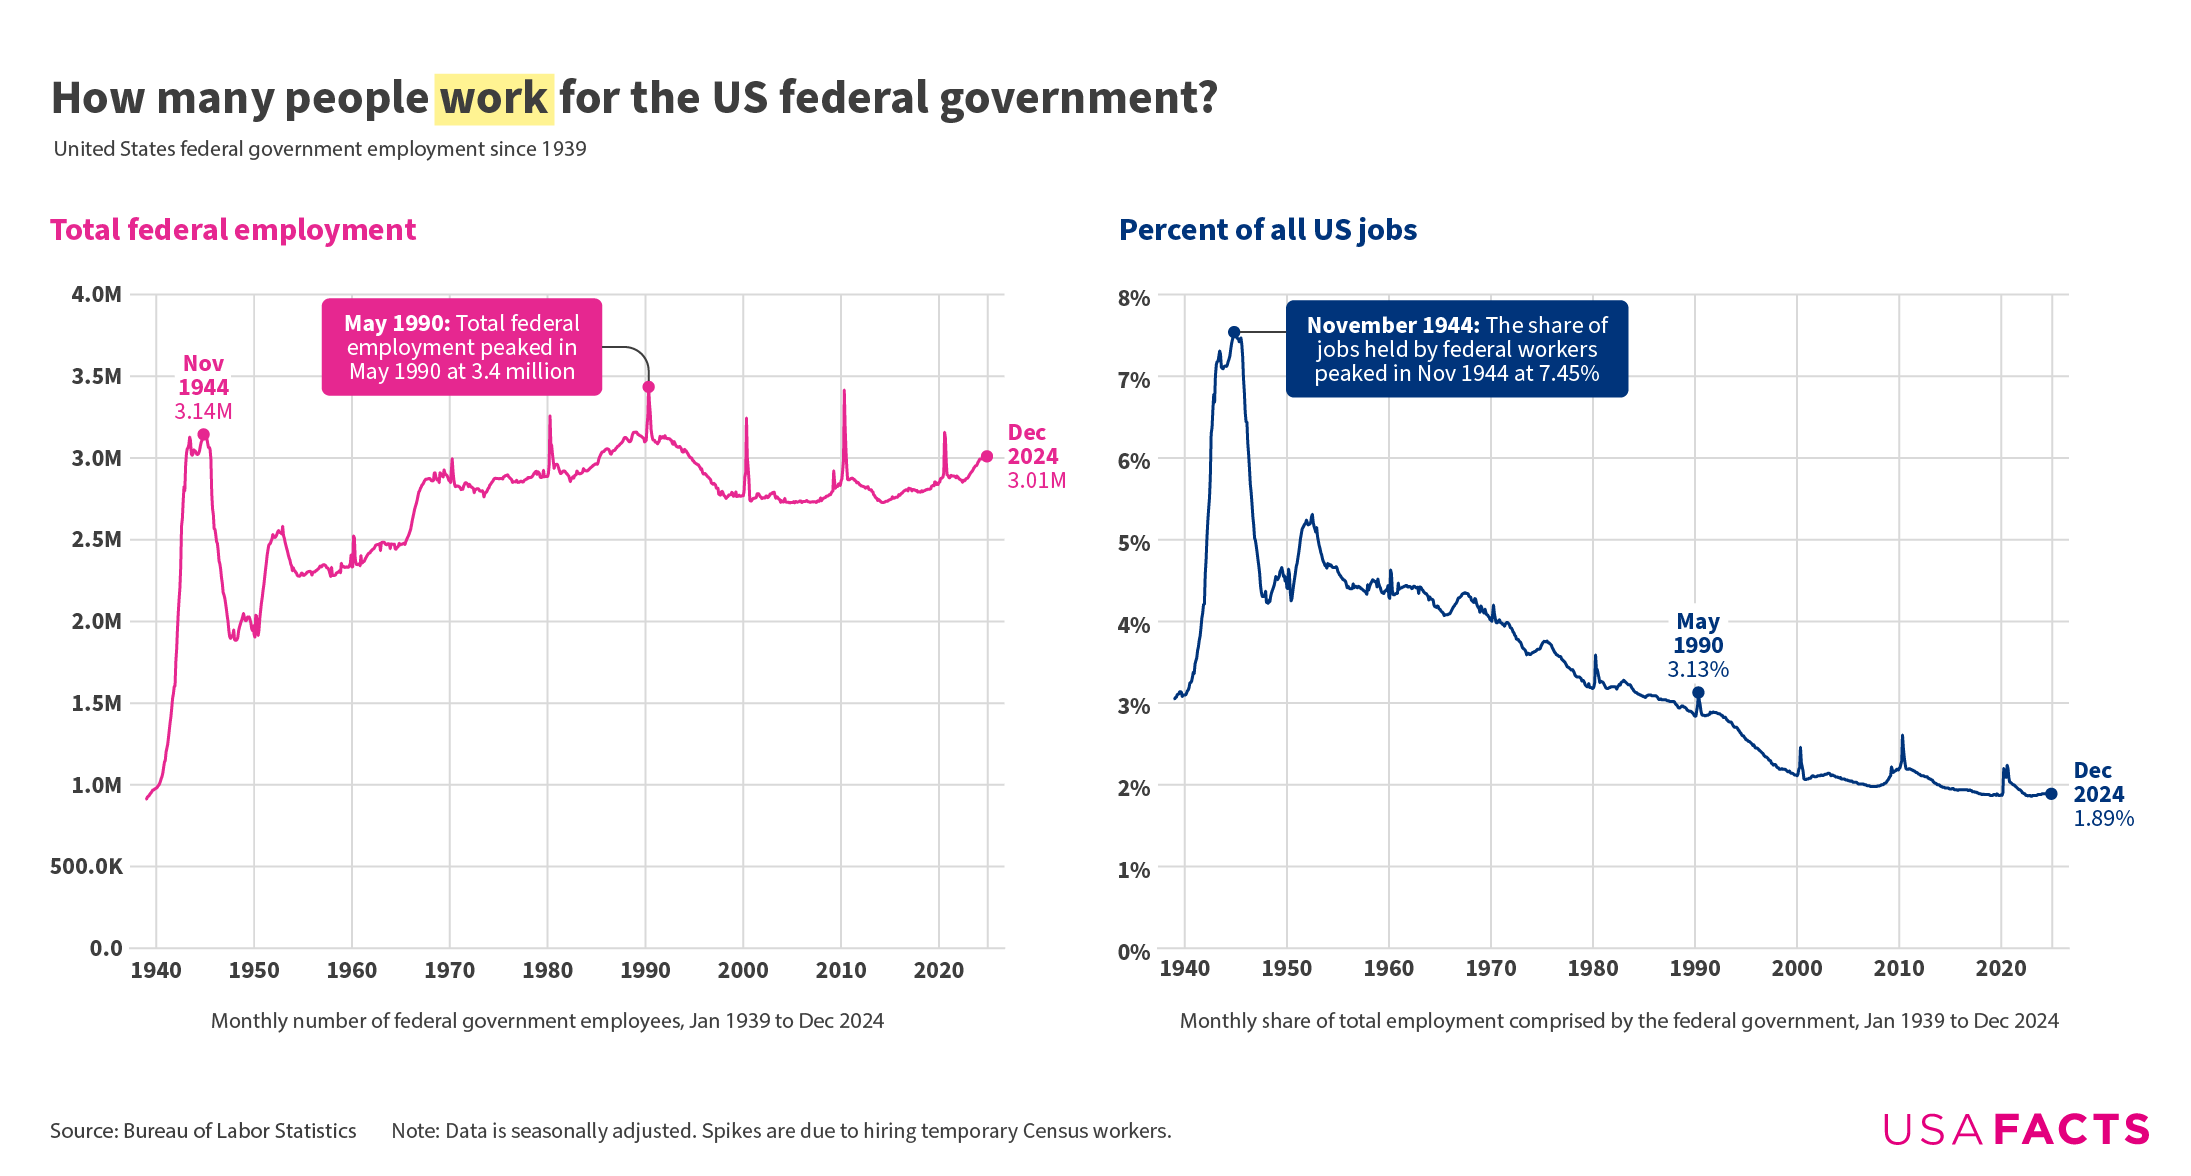

![How many people work for the US federal government? [OC]](https://www.byteseu.com/wp-content/uploads/2025/02/73ql2m0qsjhe1-1536x824.png "How many people work for the US federal government? [OC]")
24 Comments
Source: [Bureau of Labor Statistics](https://data.bls.gov/dataViewer/view/timeseries/CES9091000001)
Tools: Datawrapper, Illustrator
More data [here](https://usafacts.org/articles/how-many-people-work-for-the-federal-government/)
Why are there huge spikes for some years?
I posted a similar chart a few weeks ago and several people wanted see how federal employment compares to the US population. I chatted with some folks here and landed on using a similar measure: federal employment compared to the size of the entire US workforce.
Federal government workers per capita shows that there are about as few as there ever have been in the post-WWII era.
https://preview.redd.it/cdp0284oujhe1.png?width=1320&format=png&auto=webp&s=210d63f773e6e5d06ead31c864151295366083b5
But Fox News told me the government is a massive wasteful juggernaut that keeps growing!
A few things I find interesting:
Reagan ran on smaller government, but it only increased during his time. Maybe military? Just looked it up and during the 80’s about 75% of federal workers were military related. It’s now around 50%. Makes sense with the cold war ending.
Besides census years, it looks like it’s remained pretty steady at around 2.75 million, with a recent jump to 3 million.
A funny thing happened in the early 40’s…
So, the federal governement is in-efficient because they have less man-power. Who would’ve thunk.
Does this include contractors? If not this is pointless.
needs to be lower. Lean and mean machine
I guess the Xgovernment will gladly do what your current govermant can’t. Democracy secured.
Government employees are only part of the picture. Full-time government contractors exceed the number of civil service employees.
US economy and free market is literally insane
in other countries this rate is like 10% usually, can go up to 25% in commie or regulated countries, and trump is cutting it even further
amazing sight to behold, be proud burgerians, this is unprecedented levels of success
Meanwhile, US Government spending as a fraction of GDP keeps going up. If it’s not direct headcount costs, then it’s indirect. That would make this direct employment chart is disengenuous — it’s like Walmart saying “we have 1,000 employees, but we have 100,000 contractors.”
Need a graph separating military and including contractors
Plot against the R and Ds perception of what percentage.
IMO – any reasonable organization needs 5-10% overhead costs – running the county is no different.
Its amazing how computers and automation have made people more efficient and in spite of that, if I want to provide documents to the IRS my options are to mail or fax a document.
Its not surprising the percentage has dropped, most government employees not in the postal service or military are white collar workers. We should see these jobs becoming more efficient, its just not efficient enough considering the technology available. Anyone who has delt with the IRS, Social Security Administration, Medicare/Medicaid, etc. knows exactly how inefficient, slow, bureaucratic, and backwards these agencies are compared to walking into literally any other business short of health insurance.
Disagree? Just try calling into the IRS or SSA and lmk how that goes.
This is a pointless comparison. Government’s function has nothing to do with business.
Holy hell 3 million people in the federal government alone?!?! I thought it was less than 2.. which is still crazy
Doesn’t look so “bloated” after all, does it?
*Christian Bale American psycho meme*
Very nice. Now include contractors and non-profits using federal grant money.
A reporter asked the Hoover Dam Project Leader how many men he had working on site. He answered, “About a third of ’em.”
Meaningless. Over 10% of the Federal budget is spent on contractors, while employee salaries comprise around 7%. The actually important figure is *spending*, as a percentage of the entire U.S. economy, and relative to tax receipts.
Here is spending relative to GDP:
https://fred.stlouisfed.org/series/FYONGDA188S.
Here is tax receipts as a percentage of GDP:
https://fred.stlouisfed.org/series/FYFRGDA188S
So, what you’ll find is that in spite of “massive” tax cuts, the overall percentage of American GDP taken in taxes has remained reasonably steady at around 16% for the past 80 years. Meanwhile, government outlays as a percentage of GDP have climbed steadily higher, going from around 17% in the 1960’s to 23% today.
So the money we spend keeps going up, and the money we take in taxes remains stubbornly flat.
Where is all the money going then? Inflation adjusted expenditures looks very different.
[https://www.federalbudgetinpictures.com/total-government-spending-quadruples/](https://www.federalbudgetinpictures.com/total-government-spending-quadruples/)