
![[OC] I built a daily visualization that the community builds together! It asks you two new questions every day and you can tap on a chart based on your preferences. After responding, you can see everyone else's response, dive into some analytics, and make your friends guess where you tapped.](https://www.byteseu.com/wp-content/uploads/2025/02/08RcCpbb6nfa1U7vL5ghF2Ej48ZCADVRinumqOMQh0Q-1536x959.jpg "[OC] I built a daily visualization that the community builds together! It asks you two new questions every day and you can tap on a chart based on your preferences. After responding, you can see everyone else’s response, dive into some analytics, and make your friends guess where you tapped.")
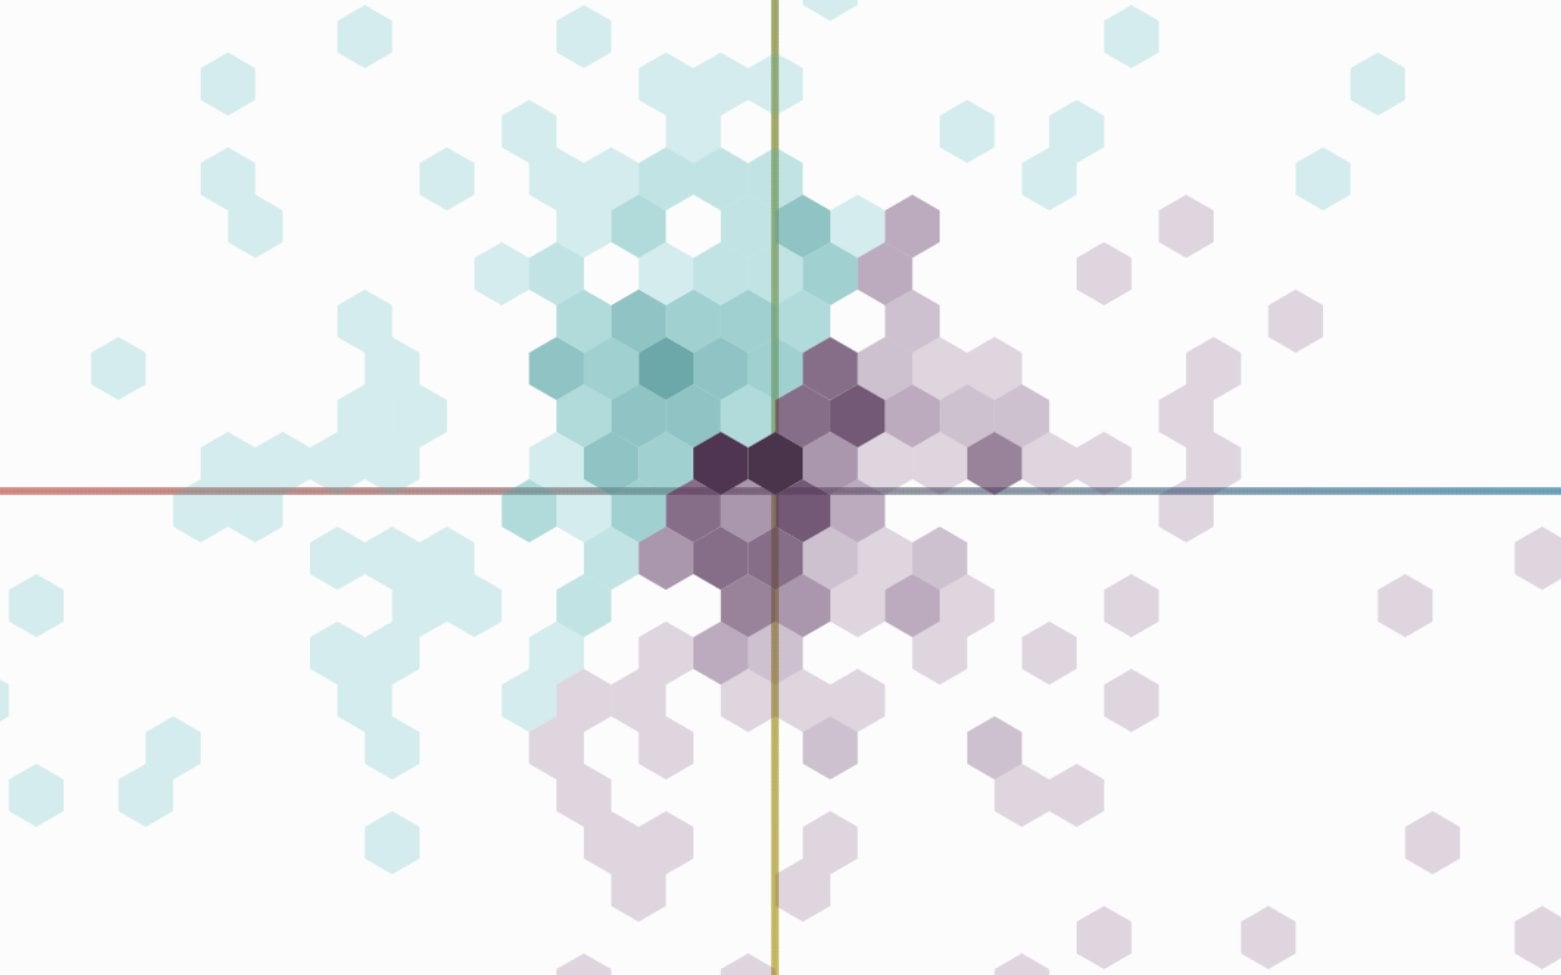
[OC] I built a daily visualization that the community builds together! It asks you two new questions every day and you can tap on a chart based on your preferences. After responding, you can see everyone else’s response, dive into some analytics, and make your friends guess where you tapped.
Posted by Shriracha
3 Comments
I shared a super early version of this last year. Since then, I’ve added a lot of new features! Some of my favorites are:
* Friend Guessing: Send a link to your friends to have them guess where you tapped on the plot.
* Global Responses: A 3D globe to show where people are responding from.
* Improved Sharing: Better options to share your answer with your friends, similar to Wordle’s text share.
Tech Stack: Built using p5.js, Vue/Nuxt, and Supabase.
Data Source: Fully crowdsourced by all of you. Thanks for checking out my project!
Original post: https://www.reddit.com/r/dataisbeautiful/comments/1cow9r3/oc_i_built_a_daily_visualization_that_the/
it’s fun! very good interface and interaction as well.
i struggled a few times to pick a space when the axes were less intuitive. for example, does the middle space between bball and baseball mean i like both or dislike both? many times my answer can best be depicted by two sliders, one for bball and one for baseball.
i found this was a challenge for me in interpreting the results of some plots, and also limits my interest in sharing with friends / seeing their responses.
I like this, how many responses are you getting a day? The plot looks pretty busy!