

Current efforts to reduce emissions fall far short of what is required to keep global warming well below 2° as established in the Paris Agreement1. In fact, global carbon emissions continue to rise, despite requirements to reach net-zero emissions within the next 30–50 years. To avoid the worst impacts of climate change, countries need to increase the ambition of their emissions reductions pledges, and to close the implementation gap between pledges and current policies. Only decades remain before CO2 emissions need to reach net-zero in mid-century2 and achieving this will require rapid learning from evidence on which policy instruments work in what contexts3.
Although current mitigation policies are insufficient to meet emissions reductions targets as specified in nationally determined contributions (NDCs), which in themselves are insufficient to achieve the temperature target of the Paris agreement1, thousands of policies have been implemented across sectors and regions, and there are some limited examples of emissions reductions in some jurisdictions and sectors4. Moreover, it has been shown that the number of policies a country enacts is associated with stronger emissions reductions5,6. Policies from around the world are collected in databases7,8 that comprise 7074 individual policies across 198 countries and territories. These databases present a valuable resource for policy learning that can help to bridge the emissions gap9.
There is also a substantial scientific literature on climate policy instruments, made up of both ex-post evaluations of instruments that have already been implemented, as well as ex-ante studies of how different instruments could reduce emissions. Both of these strands of literature are necessary for effective policy learning. However, efforts to systematize this literature10,11 have remained limited in scope in terms of instrument coverage, or outcomes studied. Key challenges that hinder systematic learning are the difficulty in defining system boundaries for climate-relevant policies, as well as a lack of consistent and comprehensive climate policy typologies.
Further, the sheer size of the literature on climate polices – which is scattered across many different scientific communities and encompassing many different sectors, instrument types, and frames of analysis – makes large-scale evidence synthesis in this area especially challenging. Given this scale and diversity of research, it is increasingly hard for scientists to stay abreast with research developments within their own fields. This is also a challenge for science assessments such as those carried out by the Intergovernmental Panel on Climate Change (IPCC)3, which is tasked with providing comprehensive assessments of the science of climate change. Digital technologies, machine learning, and natural language processing (NLP) therefore present promising avenues for making tractable the task of the IPCC, and for enabling large-scale synthetic work on which the IPCC must build12,13,14,15.
In this paper, we take a critical step towards accelerating learning on climate policies by displaying an overview of developments in the field. We use machine-learning methods from natural language processing (NLP) to systematically map the scientific literature on climate policies16. A systematic map “collates, describes, and catalogues available evidence” in order to “identify evidence for policy-relevant questions, knowledge gaps, […], and knowledge clusters”16. Rather than directly providing answers to questions about the effects of climate policies, this map shows us what has been studied and where, thereby potentially informing directions for primary research (including through funding), and enabling further evidence synthesis work, from individual reviews to scientific assessments like the IPCC. Given the size of the literature, the traditional, hand-based approach to assembling such a map is not feasible when it comes to research areas with many thousands of papers. Using a set of over 2500 hand-coded documents, we fine tune the language model ClimateBERT17 to identify the subset of 84,990 studies in the broader climate literature that investigates climate policy instruments, categorise them by policy type and sector, and determine the type of analysis applied. Our automated classification pipeline enables us to provide a living systematic map in support of research activities as well as science assessments in this space18.
In the following sections, we first characterise what a climate policy is, and develop a new typology of climate policy instruments which addresses inconsistencies and gaps in existing schemes. This allows us to operationalise a working definition of a climate policy which we use to hand-code studies and train a machine-learning model to identify and categorise the wider climate policy-relevant literature. After using our model to predict inclusion and category labels for hundreds of thousands of potentially relevant documents, we explore the landscape of climate policy research, identifying which types of instruments have been studied and where. We contrast the density of climate policy research with the density of actual policies19, and the distribution of emissions, allowing us to investigate where, and in what sectors, policy research matches enacted policies.
We set out to identify articles that study climate policy instruments which address the mitigation of climate change (instruments addressing adaptation are covered in an accompanying piece20). This requires unambiguous definitions and a comprehensive, fine-grained typology of policy instruments. We must also establish a workable definition of what constitutes a climate mitigation policy instrument. To establish clear system boundaries, we include policies only when emissions reductions are mentioned, or when a policy is unambiguously motivated by the desire to reduce GHG emissions or GHG concentrations. This is the case when a policy directly targets GHGs such as with a carbon tax or GHG emissions standard (see Methods for further discussion).
As such, an article on subsidies for renewable energy technologies would not be included unless emission reductions or climate targets were mentioned, while an article on a carbon tax or GHG emissions trading system would be included. This is because a government may have multiple reasons for supporting renewable energy technologies, such as energy security, a desire to move away from nuclear, or a reduction in local air pollution, while the climate motivation for pricing carbon is unambiguous. The instrument itself explicitly targets the reduction of greenhouse gas emissions.
We acknowledge that this means many studies of policies that have important effects in reducing emissions will be missed, but choose a definition that can be applied consistently and with minimal ambiguity. Since we do not have access to each policy and the motivations of the decision makers who enacted them, we focus on what the study itself says. If a study looks at a policy in the context of climate change or emissions reduction, we consider it a study on climate policy. We do not propose this as a superior or conclusive definition of climate policies, but simply one which can be applied with minimal ambiguity. Our dataset, on the explicit climate policy literature, therefore only represents a subset of the literature on policies that are relevant to mitigating climate change, yet it is the largest database of climate policy literature we are aware of.
We develop a new typology of climate policies (Fig. 1), which bridges the two existing typologies used in two main climate policy databases: Climate Change Laws of the World (CCLW)7 and the Climate Policy Database by the NewClimate Institute (CPDB)8. The explicit typology inherent in the International Energy Agency (IEA) policy database21 is not made public. Our typology is structured in three levels. For clarity, the typology is defined by the means by which governments or municipalities pursue policy goals. At the top level, means can be either making agreements with other actors, either state or non-state (agreements), providing funding or altering economic incentives (economic instruments), mandating what other actors must or must not do (regulatory instruments), providing information or building capacity in the expectation that it changes the behaviour of other actors (information, education, and training), or setting targets or strategies, or altering institutional arrangements (governance, strategies and targets). The second level of the hierarchy adds details on the specific type of instrument, e.g. a carbon price vs. a subsidy, while the third level offers further specifications e.g. by distinguishing between carbon taxes and emissions trading schemes, which both change economic incentives by putting a price on carbon.
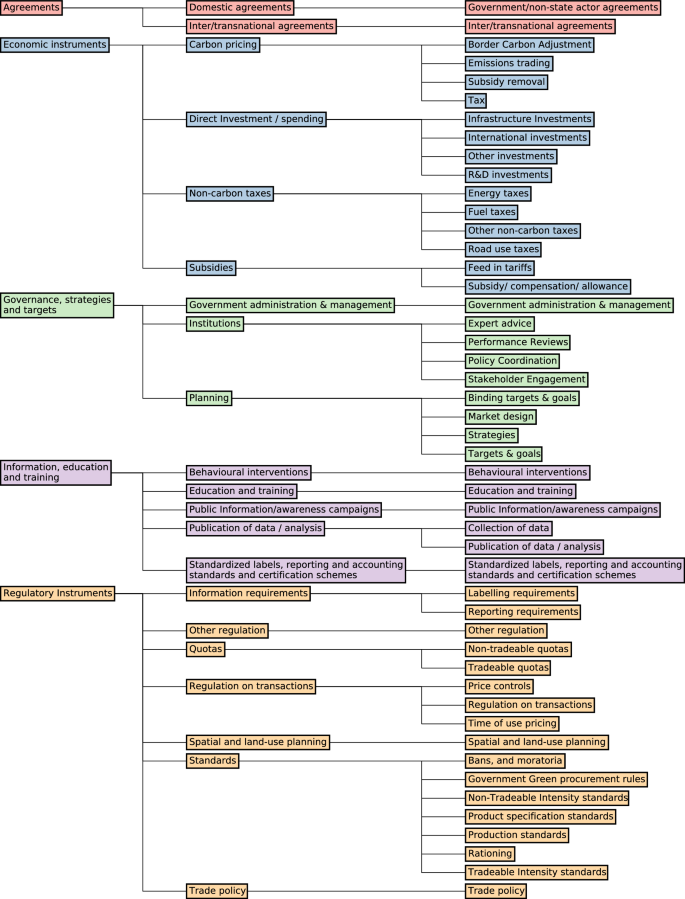
A typology of climate policy instrument types.
Supplementary Figs. 1 and 2 show the similar clusters of instrument types between our new typology and the existing policy database typologies, indicating that their structures are broadly similar. However, there are some important differences. For example, in the CCLW typology, research and development (R&D) comes under the top-level category “capacity building”, whereas we include it under investment, which is itself a sub-category of economic instruments. This is because the government, in providing funding for R&D, operates through providing resources, not by providing information. A change of curriculum in publicly funded entities, on the other hand, would be considered under the category of information, education, and training. CCLW provides a separate category for “direct investment”, with sub-categories relating to climate finance, and the provision of public goods. We argue that clarity is created by assigning sub-categories to parent categories based on how they do what they do (in this case by spending money).
This is based on the classic NATO typology22, helping to tie this work to the broader policy literature. Nodality corresponds to information, education and training, Authority corresponds to regulatory Instruments, Treasure corresponds to economic instruments, and Organisation corresponds to governance, strategies and targets. Agreements could conceivably be allocated to Authority, but given their particular function in the climate change policy realm, we assign these to a separate category. Our typology differs somewhat from the typology introduced by Sterner and Robinson23, which allows for more fine-grained distinctions between what we classify as economic instruments, but less fine-grained distinctions between what we classify as information, education, and training instruments, agreements, and governance, strategies and targets.
Strategies and targets constitute a special case of climate policy, as it could be argued that they are not instruments at all, being merely an expression of policy goals rather than means to achieve those goals. However, we argue that strategies and targets are a particular type of governance arrangement, and that they themselves have effects. As well as setting expectations for businesses and citizens, they also bind current and future governments – either legally or implicitly – to take actions in line with the strategy or target, or justify why they did not do so. We therefore include such instruments in our typology, but discuss these critically in the results section.
After converting the policy types in the CCLW and NCI databases to our own typology, we merge both databases using the title, country, and date fields using the cosine similarity of the titles. We calculate the cosine similarity of each policy in the CCLW database to each policy from the NCI database assigned to the same country and from a year not more than 1 year apart from the year given in the CCLW database. We then annotate by hand the pair with the highest similarity as either duplicated or not, assuming all pairs with a cosine similarity of 1 are duplicates, and all pairs with a cosine similarity of 0 are unique. From 2058 policies in CCLW and 5962 policies in NCI we compile 7551 unique policies, which we use for the analysis in this paper. Each individual policy can be mapped to one or more of our top level categories, and one or more sector.
To identify and classify the literature on climate change instruments, we search the open access bibliographic database OpenAlex with a query (reproduced in full in supplementary materials) which aims to identify the whole of climate literature24. This query may miss specific climate-relevant policies that do not refer to emissions reductions or climate goals, but according to our operational definition of climate policy literature, such documents would not be included in our study. Our query returned 1,026,371 studies.
We proceeded to screen these documents, marking those that were relevant according to our definition, and, if they were relevant, recording the specific climate policy instrument they focused on (at each of our 3 levels). If multiple instruments were analysed, we recorded each of these. We also recorded the sector targeted by the instrument (marking cross-sectoral where this was not specified or where the paper discussed general reductions in emissions), as well as the name of the policy instrument, the country in which the policy was enacted or envisioned, the governance level at which the policy was enacted or envisioned (sub-national, national, or supra/inter-national), whether the study provided ex-post or ax-ante analysis, or whether the methodology was quantitative or qualitative.
After hand-screening, we trained machine learning classifiers to classify each of these categories, and used a pre-trained geoparser25 to extract the locations mentioned in each study. We assessed (see methods for training and evaluation details) a variety of pre-trained language models26,27, including ClimateBERT, which had undergone additional pre-training on climate relevant texts (including scientific abstracts)17.
Based on F1 scores (which are bounded between 0 and 1 and describe the harmonic mean of precision, the proportion of predicted positive cases that are truly positive, and recall, the proportion of truly positive cases which are predicted positive) for the different labels, we find that ClimateBERT17 predicts the categories inclusion, sector, and the top level of the instrument typology best (Table 1). Here we observe a macro F1 score of 0.66 (table 1), although performance varies widely from our least frequent category (information, education and training, which achieved an F1 score of 0.31 with 57 labelled examples) to our most frequent category (economic instruments, which achieved an F1 score of 0.86 with 460 labelled examples). Classifier performance was not always reliable at the more detailed level, although our best model could identify carbon pricing with an F1 score of 0.77 (294 labelled examples), it achieved an F1 score of 0 for the category “Institutions” (44 labelled examples). We therefore refer in the following sections to instruments at the top level of the hierarchy, as well as in individual cases to specific sub-instruments that were well classified.