[OC] Interactive Scrollytelling Data story: How Swiss Research is Funded (link in comment)
Posted by ColasDoesViz

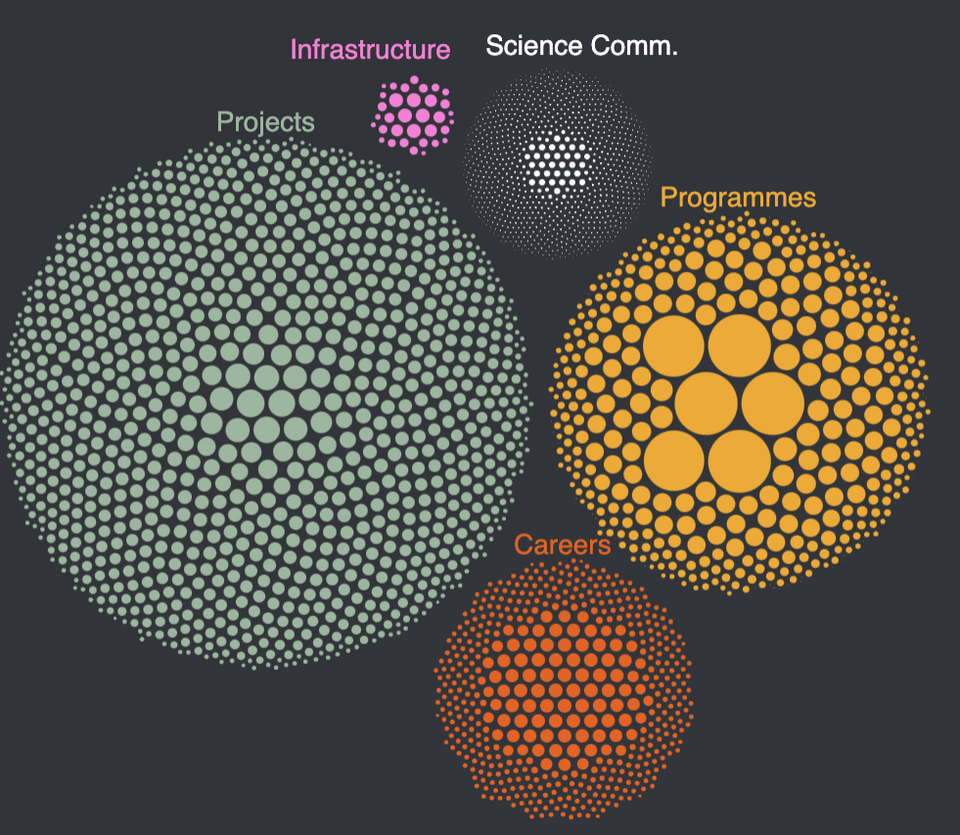
[OC] Interactive Scrollytelling Data story: How Swiss Research is Funded (link in comment)
Posted by ColasDoesViz
3 Comments
Full high-resolution interactive visualisation available at: [https://colasdroin.github.io/snsf-dataviz/](https://colasdroin.github.io/snsf-dataviz/)
Made with React + D3 + GSAP
Data source: [https://data.snf.ch/datasets](https://data.snf.ch/datasets)
Amazing work, thanks for sharing!
Great Work. One point of criticism, I find the moving text somewhat difficult to read when scrolling (it clashes a bit with the background).^(also I think there is a typo when you talk about trends “peaking around 20014”)