

The response surface design method involves the rational design of test groups based on input influencing factors. After the test, the corresponding response values of each test group are input for subsequent analysis. This method employs a multiple quadratic regression equation as the regression analysis mathematical model to describe the functional relationship between the influencing factors and the response values. Additionally, it facilitates the analysis of interactions between influencing factors. By utilizing statistical analysis methods, the optimal combination of influencing factors can be determined based on the regression equation and the desired target response effect40,41,42,43. In this study, the Central Composite Circumscribed design method (CCC), which possesses both sequential and rotational properties and offers high prediction accuracy, is chosen to analyze the response characteristics of the energy absorption device and to optimize the structural parameters of the corrugated straight tube.
Response surface test design, results and residual analysis
Based on the main structural parameters affecting the energy absorption characteristics of the device, as discussed in Chapter 4, four key structural parameters were selected as independent variables: the basic circle radius (Rb), the inner convex arc radius (Rc), the thickness (t) of the corrugated straight tube, and the curling radius (R0) of the convex guiding platform. Three response values were chosen as dependent variables: the initial peak value of the support reaction force (Fcmax), the average support reaction force (Fm) within the 70 mm to 180 mm compression displacement range, and the total energy (Ez) absorbed by the device. The CCC module in Design-Expert 13 was utilized to design a four-factor, five-level test scheme, resulting in a total of 30 experimental combinations. The structural parameters and their levels are presented in Table 2, while the test schemes and corresponding response values for each group are detailed in Table 3.
Based on the data in Table 3, the values of the fitting coefficient (R2), the adjusted fitting coefficient (Adjusted R2), and the predicted fitting coefficient (Predicted R2) were calculated for different prediction models of each response value. The analysis indicated that the prediction models for Fcmax and Ez were quadratic, while the prediction model for Fm was a two-factor interaction (2FI) model. Residual analysis was conducted based on these prediction models. Figures 9, 10, 11 present the normal probability plots of the internally studentized residuals, the plots of the internally studentized residuals versus the predicted values, and the plots of the predicted values versus the actual values for each response value.
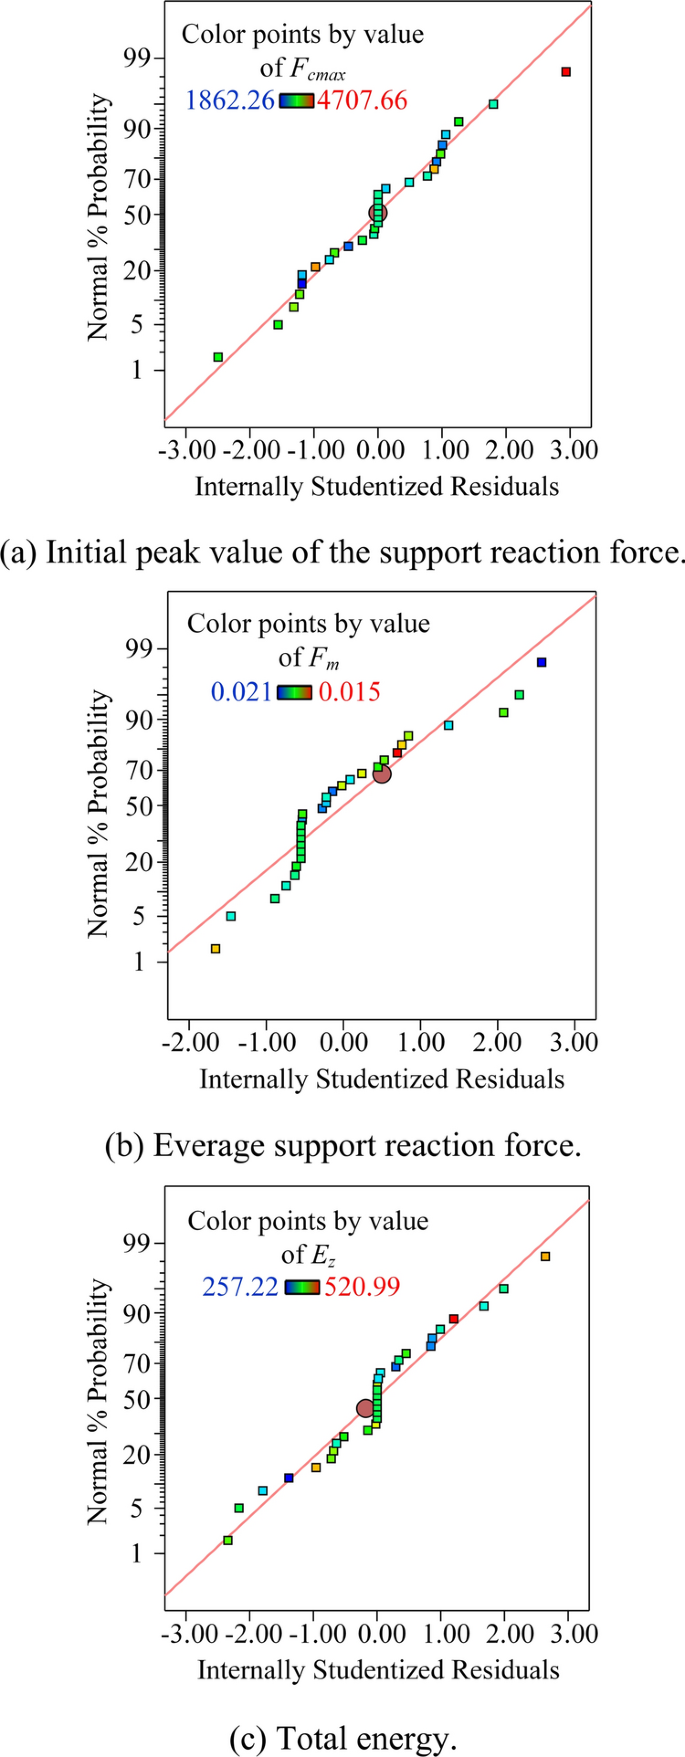
Normal distribution probability diagrams of the internally studentized residuals.
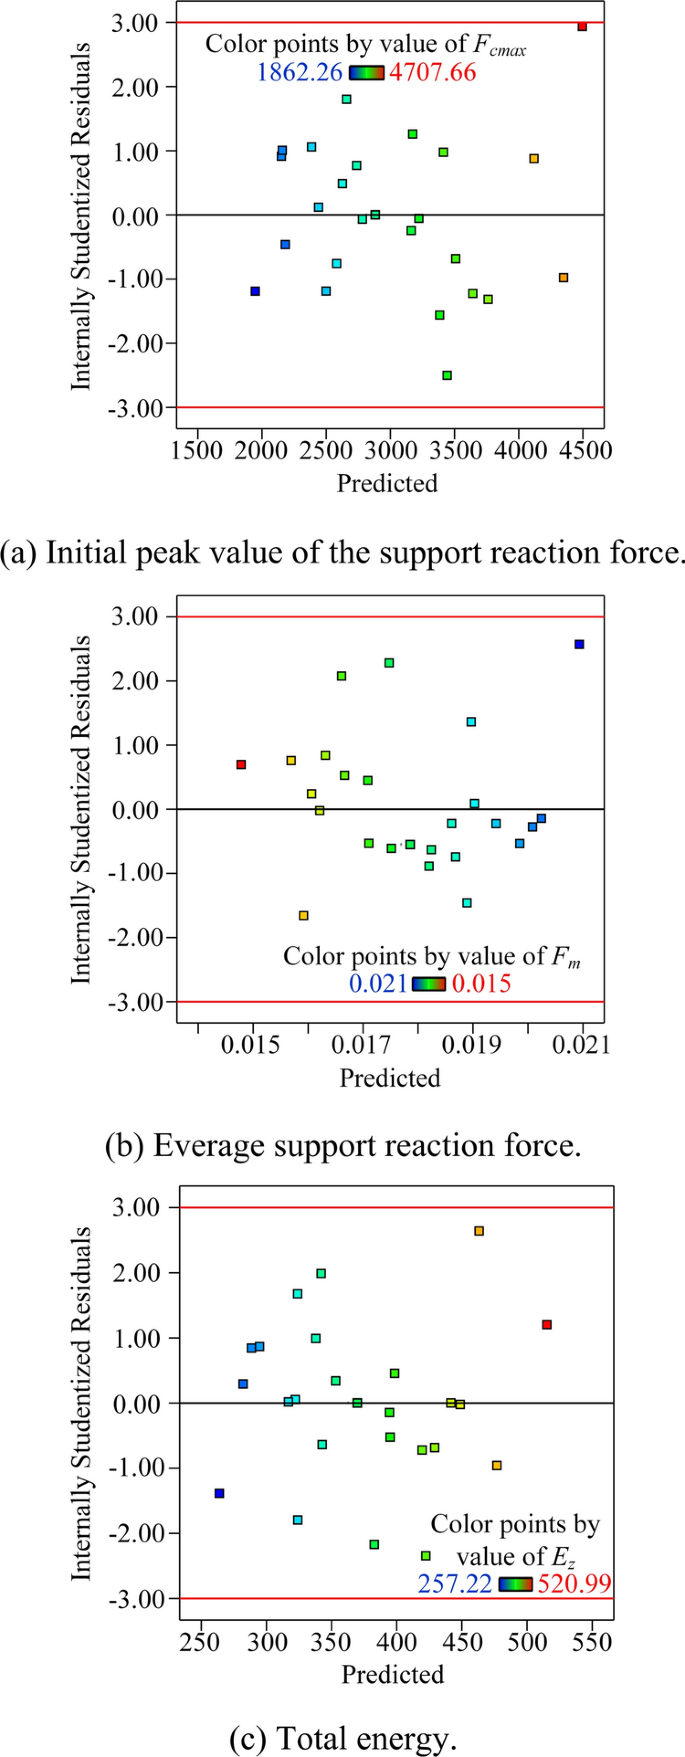
Distribution diagrams of the internally studentized residuals and the predicted values.
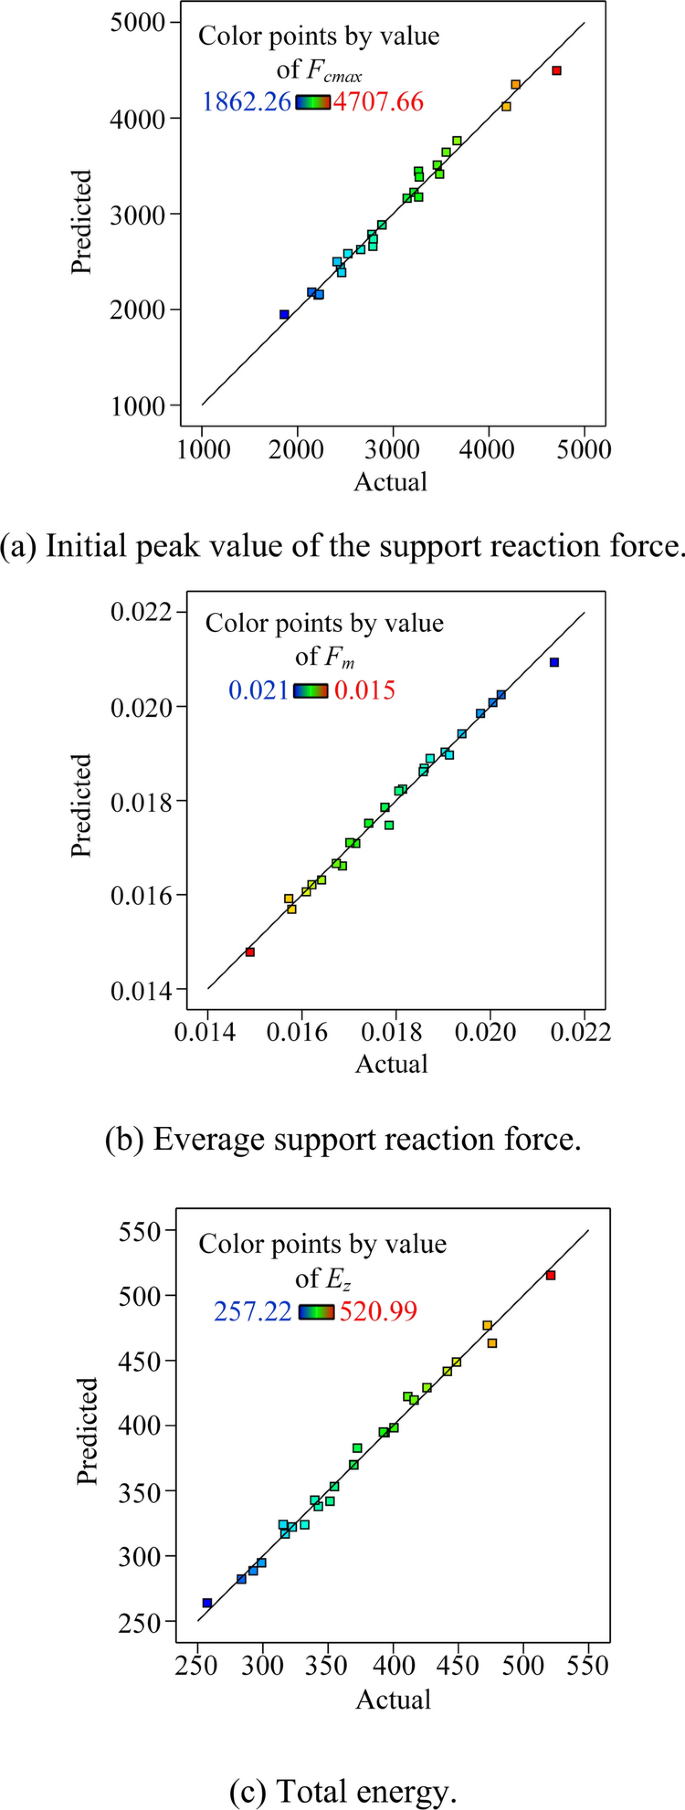
Distribution diagrams of the predicted values and the actual values.
The distribution of test points for each response value was relatively balanced, and the residuals exhibited a near-linear normal probability plot, indicating a good correlation for the prediction models. The internally studentized residuals and predicted values for each response value were randomly distributed around zero without any discernible pattern, suggesting good reliability of the prediction models. Additionally, the predicted values aligned well with the actual values for each response, closely following the fitted line without significant deviations, which further attests to the good fit of the prediction models.
Test the significance of structural parameters based on analysis of varianceSignificance analysis of the F
cmax
Based on the Quadratic model, the prediction model for the Fcmax was developed, and the fitting statistical data are presented in Table 4. Analysis revealed that the prediction model for the for the Fcmax meets the specified requirements.
The multiple regression equation for Fcmax, influenced by the variables Rb, Rc, t, and R0, is presented in Eq. 24.
$$\begin{aligned} F_{c\max } =& – 17064.67292 + 113.06604R_{b} + 3350.98292R_{c} – 4093.21583t – 2006.01583R_{0} \\ &\quad- 56.85937R_{b} R_{c} + 61.44500R_{b} t + 22.18375R_{b} R_{0} – 155.57500R_{c} t – 13.70750R_{c} R_{0} \\ &\quad- 29.60000R_{0} t + 3.60828R_{b}^{2} + 48.21688R_{c}^{2} + 339.60750t^{2} + 17.88250R_{0}^{2} \\ \end{aligned}$$
(24)
Variance analysis was performed based on the regression equation of the prediction model. The F-value of the Fcmax prediction model was 68.76, and the P-value was less than 0.0001, indicating that the model was significant and could better fit the test results. The P-values for Rb, Rc, t, and R0, the interaction terms RbRc, Rbt, and Rct, and the quadratic terms Rc2 and t2 were all less than 0.05, indicating that these factors had a significant effect on Fcmax.
The F-values of each structural parameter were analyzed as follows: Ft(783.64) > FRc(55.28) > FRb(38.28) > FR0(36.24). The analysis showed that the thickness (t) had the greatest influence on the initial peak of the reaction force, followed by the inner convex arc radius (Rc) and the basic circle radius (Rb), while the curling radius (R0) had the least influence on the initial peak value of the support reaction force.
Significance analysis of the F
m
According to the 2FI model for the Fm, the fitting statistical data are presented in Table 5. After analysis, it was found that the average branch reaction prediction model meets the specified requirements.
The multiple regression equation for Fm, influenced by Rb, Rc, t and R0, is shown in Eq. 25.
$$\begin{aligned} F_{m}^{ – 0.5}& = 0.021096 + 0.000214R_{b} – 0.005007R_{c} + 0.000513t + 0.007860R_{0} \\&\quad + 0.000034R_{b} R_{c} – 7.26253 \times 10^{ – 6} R_{b} t – 0.000080R_{b} R_{0} + 0.000157R_{c} t \\ &\quad+ 0.000113R_{c} R_{0} – 0.000509R_{0} t \\ \end{aligned}$$
(25)
Variance analysis was conducted using the regression equation of the Fm prediction model. The F-value of the Fm prediction model was 185.44, with a P-value less than 0.0001, indicating that the model was statistically significant and exhibited a good fit to the experimental results. The P-values for Rb, Rc, t, R0, and the interaction term R0t were all below 0.05, confirming that these factors had a significant influence on Fm.
The F-values for each structural parameter were analyzed as follows: Ft(1688.88) > FR0(101.14) > FRb(26.20) > FRc(20.85). This analysis revealed that the degree of influence of each structural parameter on the average support reaction force was ranked as follows, from greatest to least: thickness (t), curling radius (R0), basic circle radius (Rb), and inner convex arc radius (Rc).
Significance analysis of the E
z
Using the Quadratic model for the Ez, the fitting statistical data are presented in Table 6. After analysis, it was determined that the total energy absorption prediction model meets the required criteria.
The multiple regression equation for Ez, influenced by Rb, Rc, t and R0, is shown in Eq. 26.
$$\begin{aligned} E_{z} &= – 2617.58792 + 62.92354R_{b} + 222.45875R_{c} – 228.67750t – 254.79917R_{0} \\ &\quad- 1.97656R_{b} R_{c} + 3.12313R_{b} t + 3.17313R_{b} R_{0} – 10.74875R_{c} t – 4.15875R_{c} R_{0} \\&\quad + 7.30750R_{0} t – 0.461953R_{b}^{2} + 1.06844R_{c}^{2} + 19.74875t^{2} + 0.818750R_{0}^{2} \\ \end{aligned}$$
(26)
Variance analysis was performed based on the regression equation of this prediction model. The F-value for the Ez prediction model was 138.20, with a P-value less than 0.0001, indicating that the model was statistically significant and provided a good fit to the test results. The P-values for Rb, Rc, t, R0, the interaction term Rct, and the quadratic term t2 were all below 0.05, confirming that these factors had a significant effect on Ez.
The F-values for each structural parameter were analyzed as follows: Ft(1720.87) > FR0(84.28) > FRc(47.58) > FRb(45.36). This analysis revealed that the thickness (t) had the greatest influence on total energy absorption, followed by the curling radius (R0). The influence of the inner convex arc radius (Rc) and the basic circle radius (Rb) on total energy was similar, with the inner convex arc radius having a slightly greater impact than the basic circle radius.
Interaction analysis of structural parameters on response valuesInitial peak value of the support reaction force
The initial peak value of the support reaction force serves as a critical evaluation index for the energy absorption characteristics of the energy absorption device. Figure 12 illustrates the interaction diagrams of the structural parameters with significant effects on the initial peak value of the support reaction force.
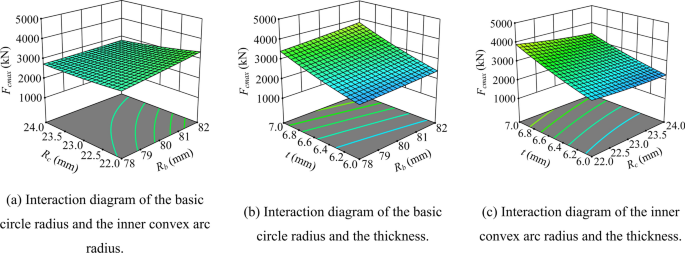
Interaction diagrams of the significant interaction terms on the initial peak value of the support reaction force.
As shown in Fig. 12a, when the thickness is 6.5 mm and the curling radius is 13 mm, the basic circle radius and the inner convex circle radius interact significantly on the initial peak of the support reaction force. When Rb increases from 78 to 82 mm, Rc values of 22 mm and 24 mm correspond to Fcmax ranges of 2859.78 kN to 3364.44 kN and 2748.67 kN to 2804.08 kN, respectively. When the Rc value is smaller, the variation in Fcmax is more pronounced. This is because, with a smaller Rc value, the cross-sectional area changes more significantly after the bottom of the corrugated straight tube is fully stretched, leading to more substantial changes in the bending force arm at the bottom of the corrugated straight tube. Consequently, the corrugated straight tube’s resistance to bending deformation increases, resulting in more significant variations in Fcmax. The Fig. 13. is shown as a picture of the change of the bending force arm of the energy absorption device corresponding to the Rc values of 22 mm and 24 mm, respectively.
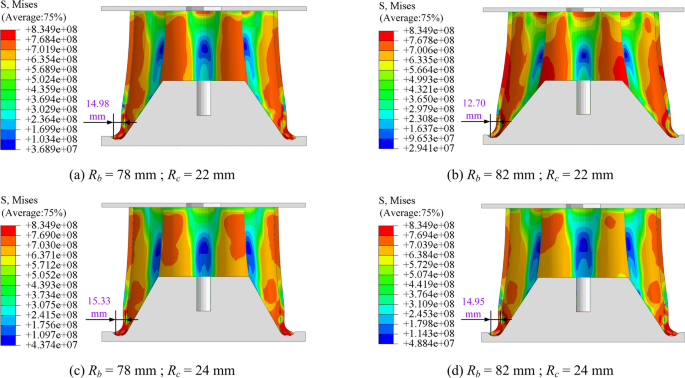
Rc = 22 mm and Rc = 24 mm corresponding to the energy absorption device bending force arm changes.
As illustrated in Fig. 12b and c, when Rb = 80 mm, Rc = 23 mm, and R0 = 13 mm, the variation range of Fcmax corresponding to an increase in t from 6 to 7 mm is from 2331.67 kN to 3601.79 kN, indicating that Fcmax is positively correlated with t. This positive correlation arises because, with the increase in t, the cross-sectional area of the bottom end of the corrugated straight tube involved in bending deformation exhibits a noticeable upward trend. Consequently, the resistance of the corrugated straight tube to bending deformation is enhanced. Furthermore, when Rb = 80 mm, t = 6.5 mm, and R0 = 13 mm, a decrease in Rc from 24 to 22 mm corresponds to a variation range of Fcmax from 2762.85 kN to 3100.42 kN. In this scenario, Fcmax exhibits a linear upward trend as Rc decreases.
Average support reaction force
The average support reaction force reflects the overall load-bearing capability of the energy absorption device. The interaction effect of the significant interaction term R0t on the average support reaction force within the 70 mm to 180 mm compression displacement range is illustrated in Fig. 14.
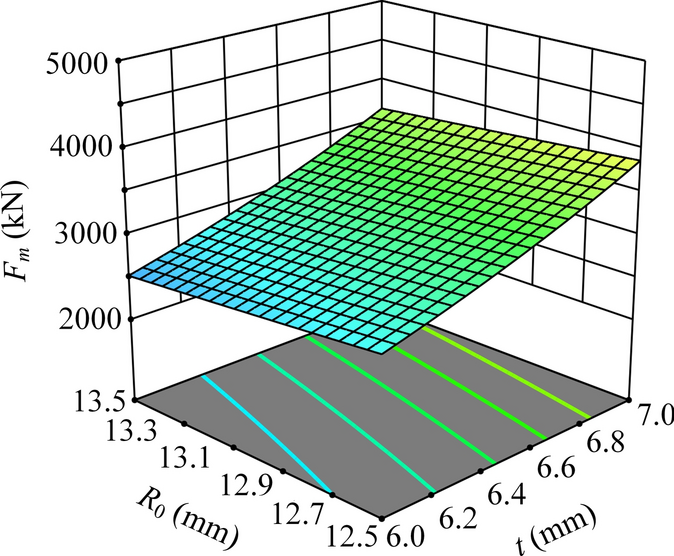
Interaction diagram of the curling radius and the thickness on the average support reaction force.
When Rb = 80 mm, Rc = 23 mm, and t = 6.5 mm, the dimensions of the corrugated straight tube remain constant. Changing R0 from 12.5 to 13.5 mm results in a decrease in the Fm value from 3273.63 to 3013.08 kN, indicating a downward trend in the average support reaction force. This trend is attributed to the increase in R0, which deepens the curved rounded surface and enhances the degree of stretching and flaring at the lowest point of the corrugated straight tube’s rounded surface. Consequently, the bending force arm at the bottom of the corrugated straight tube increases, weakening its ability to resist bending deformation. This makes the subsequent bonding, curling, and rolling deformation processes at the corrugated straight tube’s end easier to achieve, thereby reducing the overall load-bearing capacity of the energy absorption device. The Fig. 15. is shown as a picture of the change of the bending force arm of the energy absorption device corresponding to the R0 values of 12.5 mm and 13.5 mm, respectively.
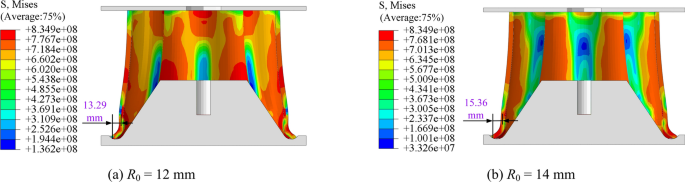
R0 = 12 mm and R0 = 14 mm corresponding to the energy absorption device bending force arm changes.
Compared to R0, the influence of t on Fm is more significant. The volume of the corrugated straight tube involved in buckling deformation and the load-bearing capacity of the energy absorption device are positively correlated with t. The maximum value of Fm occurs when t is at its maximum (t = 7 mm) and R0 is at its minimum (R0 = 12.5 mm).
Total energy
The total energy refers to the sum of energy absorption in the buckling deformation process of the energy absorption device, and its value reflects the energy absorption effect of the energy absorption device. When the basic circle radius was 80 mm and the curling radius was 13 mm, the interaction response effect of the inner convex arc radius and the thickness on the total energy was shown in Fig. 16.
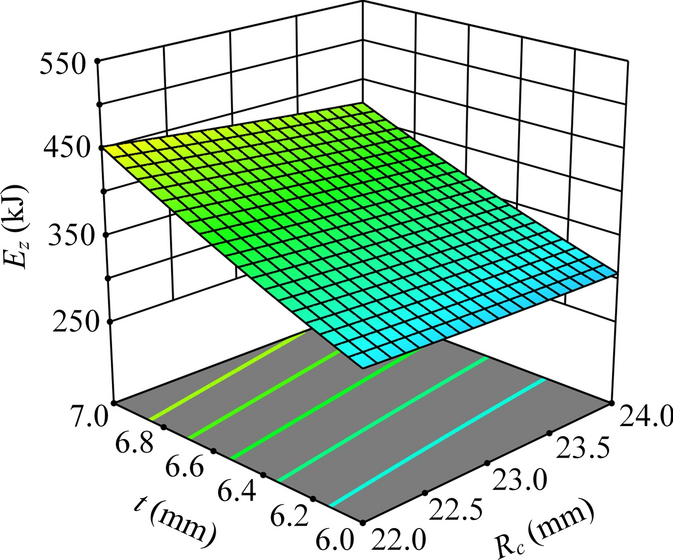
Interaction diagram of the inner convex arc radius and the thickness on the total energy.
When Rb = 80 mm, t = 6.5 mm and R0 = 13 mm, Rc decreases from 24 to 22 mm, Ez varies from 360.51 kJ to 381.93 kJ. When Rb = 80 mm, Rc = 23 mm and R0 = 13 mm, Ez varies from 311.95 kJ to 437.55 kJ as t increases from 6 to 7 mm. Compared with the effect of Rc on Ez, t has a greater effect on the cross section area, which in turn has a more significant effect on Ez. When Rc is the smallest (Rc = 22 mm) and t is the largest (t = 7 mm), Ez is the largest.
Acquisition of optimal structural parameters of the energy absorption device
In the specified value ranges for the basic circle radius, inner convex arc radius, thickness, and curling radius, a higher initial peak value of the support reaction force within the range of 2400–3000 kN, along with a higher average support reaction force and total energy, indicated better energy absorption and impact resistance of the energy absorption device. Using Design-Expert 13 software, each structural parameter was optimized and analyzed based on multiple regression equations and response value optimization objectives. This process yielded five groups of optimization test schemes, as detailed in Table 7. According to the optimization objectives, the response values of the five groups of schemes were compared, and the fifth group was selected as the optimal scheme. The optimal structural parameters were as follows: the basic circle radius was 80.285 mm, the inner convex arc radius was 22.881 mm, the thickness was 6.555 mm, and the curling radius was 12.993 mm.
Considering the practical aspects of manufacturing the energy absorption device, the optimal structural parameters needed to be rounded. After rounding, the structural parameters were as follows: the basic circle radius was 80 mm, the inner convex arc radius was 23 mm, the thickness was 6.5 mm, and the curling radius was 13 mm. Numerical simulation analysis of the energy absorption device was then conducted based on these rounded size parameters. The numerical simulation results were compared with those of the optimal test scheme. The initial peak value error rate was 3.92%, the average support reaction force error rate was 1.42%, and the total energy error rate was 2.62%, all of which were less than 5%. The energy absorption device designed based on the rounded structural parameters demonstrated excellent energy absorption and impact resistance performance.