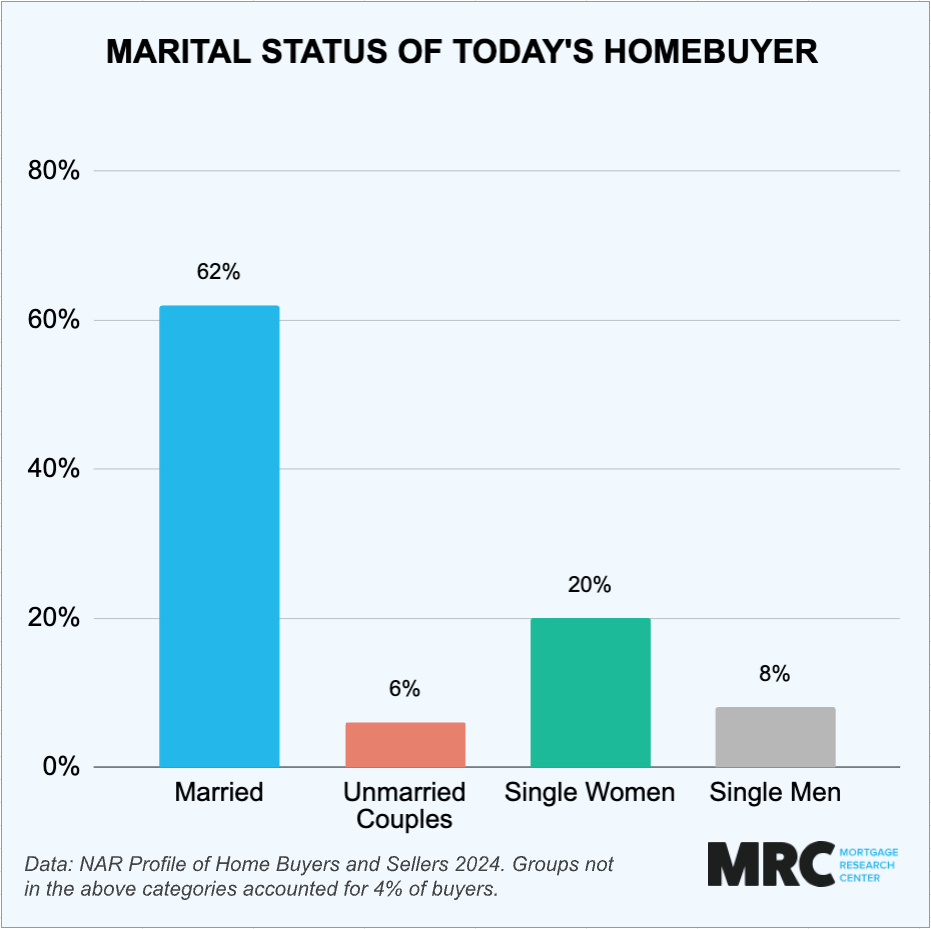
A very simple but telling graphic of the makeup of today’s homebuyers. Most buyers are either married or unmarried but buying with a partner. Today’s interest rates and home prices make it difficult or impossible to buy a home on your own. Surprisingly, though, 20% of buyers are single women. Men don’t show as much resolve though, making up just 8% of the market. I dug into some wage and home price data as well, and it’s no wonder that most homes are purchased by couples. While the average U.S. worker’s monthly income is $5,022 according to the [Bureau of Labor Statistics](https://www.bls.gov/cps/cpsaat39.htm), the average house is [$419,200](https://fred.stlouisfed.org/series/MSPUS). At a 7% example interest rate and 5% down, the house payment including est. taxes/insurance/PMI might be $3,357 per month, or 67% of pre-tax salary.
[deleted] on
[deleted]
Koppensneller on
This is just the US, right? Because in my corner of the world, it is much more common for unmarried people to buy a house together than this graph suggests.
chocolateandcoffee on
It feels like all this sub is now is bar charts trying to send a message of some sort. Although, I’m not sure what the takeaway here even is. Two people are better able to afford a home maybe.
StarSlayerX on
Hard to own a household on a single income…. I wouldn’t be surprised some people went poly to afford a home.
AgentSquishy on
Single buyers are actually higher than I’d expect. This data doesn’t tell us much without historical data to compare it against though
kfury on
A small number of categories in a zero-sum space? It feels like this is exactly where you’d want to use a pie chart.
badchad65 on
This would be far more informative if we had something to compare “todays” homebuyer too. Or has nothing changed?
Dirty_Dragons on
I’m surprised that single women is higher than single men.
Is there any reason why that’s the case? I assume that men would be more likely to own since they in general make more money. I also assumed that men would be more likely to live alone.
mynameisnotderrek on
I’m more interested in the 12% increase for single women over men, in a world where overall wage gaps are still relevant in mainstream media. More focus on home ownership?
accraTraveler on
Would love to see the marital background of the single home owners
Strange_Airships on
I’m a single woman and a single mom. I bought our first house when I was married. I was the breadwinner and he ended up somehow getting most of the proceeds from the sale. I actually took $8k of it to pay for my mom’s hearing aids so he couldn’t get the last bit. I also have never received child support even though the kiddo is with me full time.
6 years after the divorce, I finally scraped enough together to buy another house. This one is in my name only and I’m so fucking proud to have gotten back here despite all the nonsense I’ve had to deal with. My house was built in the 1800s, so I’ve learned to do a lot of electrical, plumbing, and other repairs to keep it functional too.
A lot of women are nesters. We like putting effort into making our living space a home. I’m not surprised to see such a high percentage of single women!
jkswede on
Now do truck buyers. That’s where single dude money goes
TheBatemanFlex on
I AM THE 8 PERCENT! *sobs*
Llcisyouandme on
Is this queried by home or by person? One home from each stack would have two married people, two unmarried of a couple, a single man, and a single woman. It would be critical also to know relative proportions in the general population.
This is home buyers and sellers, so widows, widowers, divorced all are part of the deal. This chart really says nothing.
toxiamaple on
Are single women really divorced women? Or single – never been married – women?
Because it is not the same thing.
MoreGaghPlease on
How is this data beautiful?
– why choose bars to depict percentages?
– why not indicate where this refers to?
– what information is this really trying to convey? Like has this changed over time? Is it just a proxy for age or other factors?

17 Comments
Data from [National Association of Realtors Profile of Home Buyers and Sellers 2024](https://www.nar.realtor/sites/default/files/2024-11/2024-profile-of-home-buyers-and-sellers-highlights-11-04-2024_2.pdf). Tool: Google Sheets.
A very simple but telling graphic of the makeup of today’s homebuyers. Most buyers are either married or unmarried but buying with a partner. Today’s interest rates and home prices make it difficult or impossible to buy a home on your own. Surprisingly, though, 20% of buyers are single women. Men don’t show as much resolve though, making up just 8% of the market. I dug into some wage and home price data as well, and it’s no wonder that most homes are purchased by couples. While the average U.S. worker’s monthly income is $5,022 according to the [Bureau of Labor Statistics](https://www.bls.gov/cps/cpsaat39.htm), the average house is [$419,200](https://fred.stlouisfed.org/series/MSPUS). At a 7% example interest rate and 5% down, the house payment including est. taxes/insurance/PMI might be $3,357 per month, or 67% of pre-tax salary.
[deleted]
This is just the US, right? Because in my corner of the world, it is much more common for unmarried people to buy a house together than this graph suggests.
It feels like all this sub is now is bar charts trying to send a message of some sort. Although, I’m not sure what the takeaway here even is. Two people are better able to afford a home maybe.
Hard to own a household on a single income…. I wouldn’t be surprised some people went poly to afford a home.
Single buyers are actually higher than I’d expect. This data doesn’t tell us much without historical data to compare it against though
A small number of categories in a zero-sum space? It feels like this is exactly where you’d want to use a pie chart.
This would be far more informative if we had something to compare “todays” homebuyer too. Or has nothing changed?
I’m surprised that single women is higher than single men.
Is there any reason why that’s the case? I assume that men would be more likely to own since they in general make more money. I also assumed that men would be more likely to live alone.
I’m more interested in the 12% increase for single women over men, in a world where overall wage gaps are still relevant in mainstream media. More focus on home ownership?
Would love to see the marital background of the single home owners
I’m a single woman and a single mom. I bought our first house when I was married. I was the breadwinner and he ended up somehow getting most of the proceeds from the sale. I actually took $8k of it to pay for my mom’s hearing aids so he couldn’t get the last bit. I also have never received child support even though the kiddo is with me full time.
6 years after the divorce, I finally scraped enough together to buy another house. This one is in my name only and I’m so fucking proud to have gotten back here despite all the nonsense I’ve had to deal with. My house was built in the 1800s, so I’ve learned to do a lot of electrical, plumbing, and other repairs to keep it functional too.
A lot of women are nesters. We like putting effort into making our living space a home. I’m not surprised to see such a high percentage of single women!
Now do truck buyers. That’s where single dude money goes
I AM THE 8 PERCENT! *sobs*
Is this queried by home or by person? One home from each stack would have two married people, two unmarried of a couple, a single man, and a single woman. It would be critical also to know relative proportions in the general population.
This is home buyers and sellers, so widows, widowers, divorced all are part of the deal. This chart really says nothing.
Are single women really divorced women? Or single – never been married – women?
Because it is not the same thing.
How is this data beautiful?
– why choose bars to depict percentages?
– why not indicate where this refers to?
– what information is this really trying to convey? Like has this changed over time? Is it just a proxy for age or other factors?