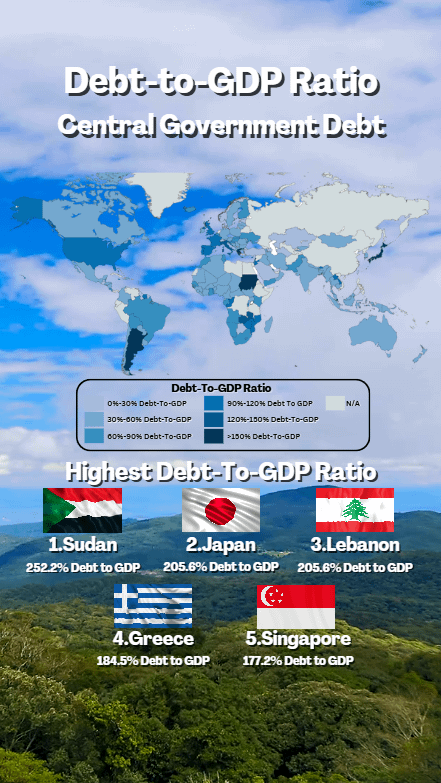
Countries continues to outspend their revenues, which is quickly becoming an international debt issue
Source: https://www.imf.org/external/datamapper/CG_DEBT_GDP@GDD/CHN/FRA/DEU/ITA/JPN/GBR/USA
Posted by AtlasandEconomy

Countries continues to outspend their revenues, which is quickly becoming an international debt issue
Source: https://www.imf.org/external/datamapper/CG_DEBT_GDP@GDD/CHN/FRA/DEU/ITA/JPN/GBR/USA
Posted by AtlasandEconomy
3 Comments
Source of the data: [https://www.imf.org/external/datamapper/CG_DEBT_GDP@GDD/CHN/FRA/DEU/ITA/JPN/GBR/USA](https://www.imf.org/external/datamapper/CG_DEBT_GDP@GDD/CHN/FRA/DEU/ITA/JPN/GBR/USA)
Map Created Using:
[https://www.mapchart.net/index.html](https://www.mapchart.net/index.html)
Visual Created Using:
[Canva.com](http://Canva.com)
I’ve heard a lot about how Greece and Lebanon are getting totally screwed because of their debt, but Japan seems to be running like normal? What are the implications for being this in debt?
The background image makes the map much harder to read, especially because it uses similar colors, and is not otherwise relevant.
The drop-shadows make the text harder to read.
The legend entries don’t each need to say “Debt-To-GDP”, and their text could be bigger/more readable if they didn’t.