I’ve never shared my work before, but today I’m posting my first analysis!
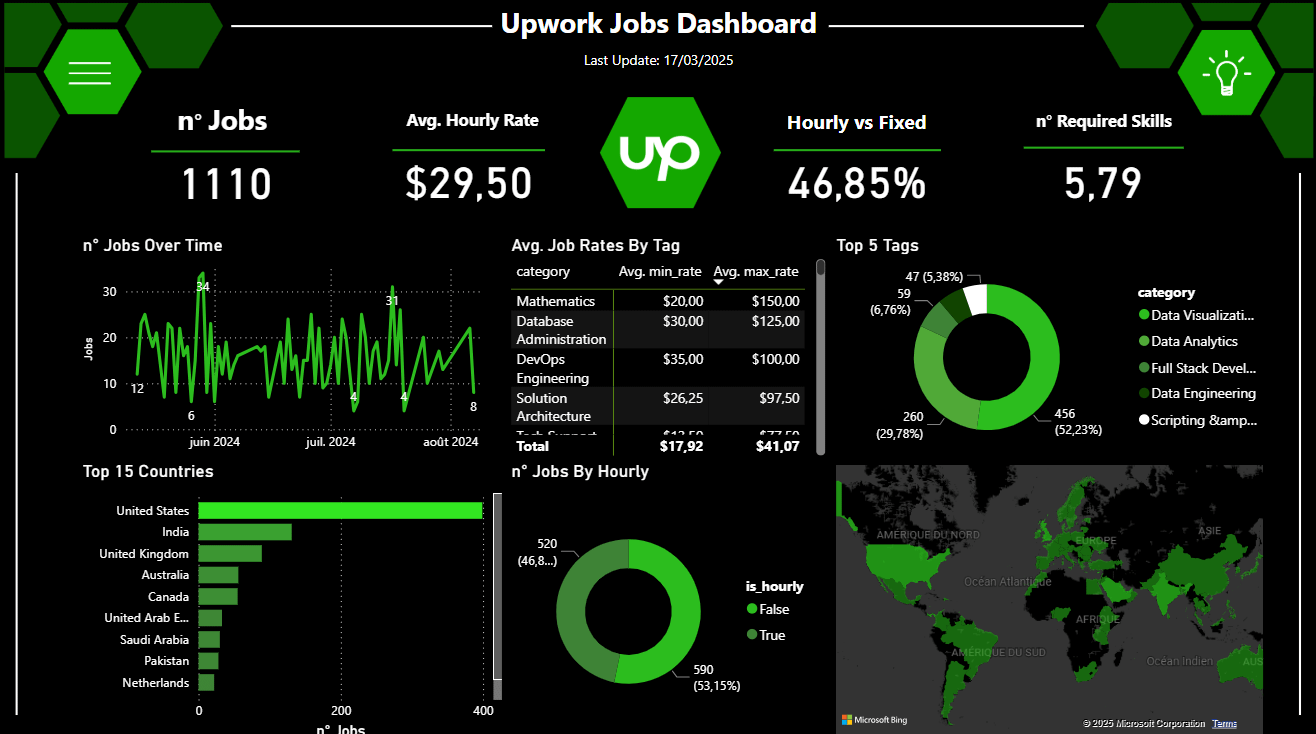
I studied **1,110 Power BI job listings** and built a dashboard to showcase trends.
🔹 **Where are the most jobs?** 🇺🇸 US (36%), 🇮🇳 India (12%), 🇬🇧 UK (8%), 🇦🇺 Australia (5%)
🔹 **Who pays the best?** 🇦🇺 Australia ($22–49/hr), 🇺🇸 US ($19–42/hr), 🇨🇦 Canada ($20–39/hr)
🔹 **Most in-demand skills:** Power BI, SQL, Python, Data Visualization
__Rick_Sanchez__ on
Upwork is a straight up scam.
Lougseco on
* **Source:** Upwork job listings (collected via RSS feed search for “PowerBI” from May–August 2024)
* **Tool Used:** Power BI for visualization, Python (Pandas, LangChain) for data processing
* **Methodology:**
* Automated data collection using an RSS feed
* Cleaned & structured data using Python (Pandas, Regex)
* Extracted job trends, skills, and rates
* Visualized in Power BI
**Raw Data & Scripts:**
Happy to share everything, let me know if you’d like access to the scripts or cleaned dataset
GodzillasVater on
I am sad you did not wait for one more job in your dataset to reach 1,111.
OldSports-- on
Good Work my friend! 🙂
The only downside I see is the overuse of the colour green in the data. Especially in the Top 5 Tags I can’t see what green stands for what xD

![I Analyzed 1,110 Power BI Jobs on Upwork [OC]](https://www.byteseu.com/wp-content/uploads/2025/03/2unl3onyrlpe1-1024x571.png "I Analyzed 1,110 Power BI Jobs on Upwork [OC]")
5 Comments
I’ve never shared my work before, but today I’m posting my first analysis!
I studied **1,110 Power BI job listings** and built a dashboard to showcase trends.
🔹 **Where are the most jobs?** 🇺🇸 US (36%), 🇮🇳 India (12%), 🇬🇧 UK (8%), 🇦🇺 Australia (5%)
🔹 **Who pays the best?** 🇦🇺 Australia ($22–49/hr), 🇺🇸 US ($19–42/hr), 🇨🇦 Canada ($20–39/hr)
🔹 **Most in-demand skills:** Power BI, SQL, Python, Data Visualization
Upwork is a straight up scam.
* **Source:** Upwork job listings (collected via RSS feed search for “PowerBI” from May–August 2024)
* **Tool Used:** Power BI for visualization, Python (Pandas, LangChain) for data processing
* **Methodology:**
* Automated data collection using an RSS feed
* Cleaned & structured data using Python (Pandas, Regex)
* Extracted job trends, skills, and rates
* Visualized in Power BI
**Raw Data & Scripts:**
Happy to share everything, let me know if you’d like access to the scripts or cleaned dataset
I am sad you did not wait for one more job in your dataset to reach 1,111.
Good Work my friend! 🙂
The only downside I see is the overuse of the colour green in the data. Especially in the Top 5 Tags I can’t see what green stands for what xD