

To initiate the study, the research area was selected on the geographical location of Sanasi Hostel Block in SRM Institute of Science and Technology Subsequently, data about wind velocity and solar radiation was obtained. Upon completion, a load profile was developed. The variability and intermittency of green energy sources, such as solar and wind, pose significant difficulties in forecasting and balancing energy generation with consumption. Subsequently, the optimal result was determined by conducting a simulation of the input data utilizing HOMER before further action. Solar and wind profile of the site is depicted in Fig. 5.
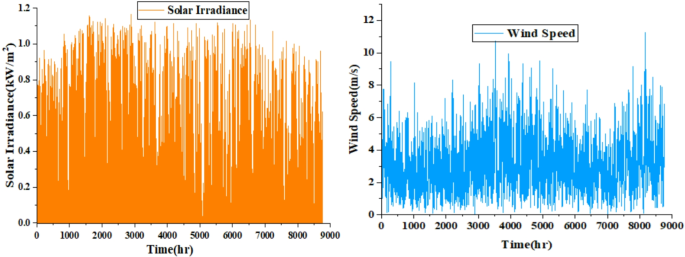
Solar and wind profile for one year.
Finally, FLC was utilized as the fundamental basis for the creation of an Energy Management Strategy. In Fig. 6 shown result of convergence curve of Firefly, PSO, GA Algorithm.
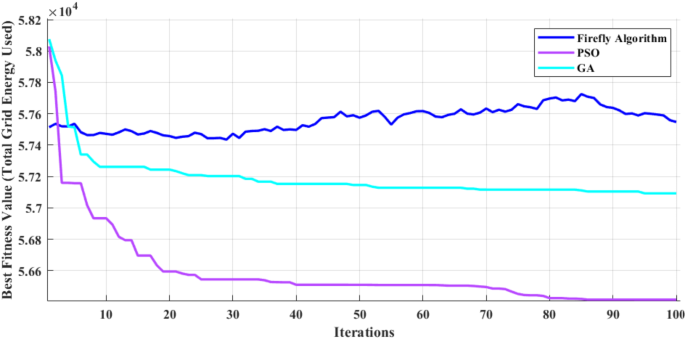
Convergence curve of firefly, PSO, GA algorithm.
A comprehensive economic analysis is conducted in HOMER with different input parameters, including load following and cycle charging strategies. The microgrid will incorporate a hybrid arrangement of solar, wind energy, and energy storage devices, all of which will be interconnected with the electrical grid power system. The preferred research site is the Sanasi Hostel Block located in SRM Institute of Science and Technology. The precise geographical location of Chengalpattu, Tamil Nadu, India is at coordinates 12°49.4’N and 80°2.6’E.
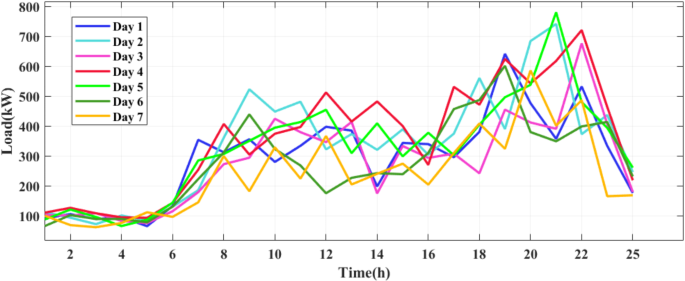
Load profile
The forecasting of electricity load demand is conducted meticulously taking into account the requirements and duration of appliance usage for the loads. The electricity demand is particularly high during the early morning and evening hours. Conversely, during daytime hours, the load is anticipated to be relatively lower. Load Analysis is done and the calculated mean load is 303.01 kW, Maximum Load is 780.22 kW, Minimum Load is 61.47 kW as shown in Table 4.
HOMER with numerous input parameters, using load following and cycle charging technique is used to conduct microgrid optimisation, a realistic electricity consumption profile of the study site was accounted for analysis. Load variations for the considered timeframe is depicted in Fig. 7. Table 5 illustrates the computed LCOE and NPC costs derived from optimisation techniques and fuzzy EMS, demonstrating that the unique energy management strategy incorporating Fuzzy Logic incurs reduced costs in comparison to existing optimisation methods. Fuzzy EMS improves LCOE relative to alternative optimization techniques. Fuzzy EMS enhances energy management by 41.40% LCOE in comparison to the Firefly Algorithm. It decreases expenses by 24.09% more effectively than the PSO Algorithm. In comparison to the Genetic Algorithm, the Fuzzy EMS demonstrates a 45.02% reduction in LCOE, hence establishing its capacity to provide a more economical energy solution.
The findings indicate that the Fuzzy EMS enhances energy systems, rendering it a cost-effective and efficient solution for energy cost management.
Optimum configuration
There are six best configurations for the hybrid microgrid that was developed for the chosen region using Homer for analysing. The configurations are based on the NPC and LCOE costs as follows: solar with grid, grid with wind, solar photovoltaic with wind and grid, solar photovoltaic with grid and battery, wind with grid and battery, and solar photovoltaic with wind and battery linked to grid. The research observed the daily energy combination of hybrid sources for a week to assess EMS control functioning for varying energy needs. Table 6 contains a tabulation of the optimal options. It also presents the various expenditures associated with each design, taking into account the optimal result, including LCOE, NPC, and operating costs.
For NPC, the combinations of Solar, Grid, Wind, and Battery (Type 6) and Solar, Grid, and Battery (Type 4) demonstrate the lowest values at $288755.04 but Grid, Wind, and Battery (Type 5) has the greatest value at $2237851.56. LCOE expenses fluctuate, with “Solar, Grid, Wind, and Battery” and “Solar, Grid, and Battery” exhibiting the lowest cost at $0.0087 whereas “Grid, Wind, and Battery” demonstrates the most at $0.067.
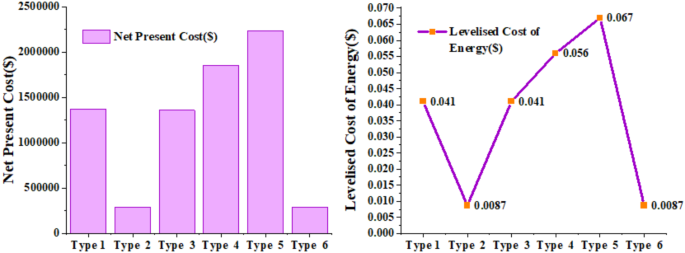
Calculated LCOE AND NPC for six cases.
The integration of Solar, Grid, and Battery (Type 4) exhibits superior economic performance across all measures. Figure 8 compares NPC and LCOE among various energy source combinations.
Type 1- solar PV with grid configuration
According to the NPC and LCOE calculated, the Solar and Grid configuration has an NPC of $ 1,371,618 an LCOE of $ 0.041 and an operating cost ($) of $ 96,252. This design considers.
Solar PV system interconnected with Grid. Figure 9 illustrates solar with grid design with solar power generated 24,390 kW power purchased from the grid is 2,798 kW.
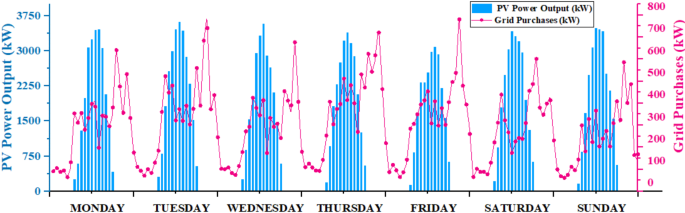
Hour-wise energy demand distribution for solar PV with grid configuration.
Type 2- wind with grid configuration
Wind with grid arrangement has a $ 156,409 operational cost ($), an LCOE of $ 0.067, and an NPC of $ 2,237,852. Figure 10 depicts a wind with grid configuration system consisting of 3663 kilowatts of produced from wind energy, 3309 kilowatts of purchased power from the grid.
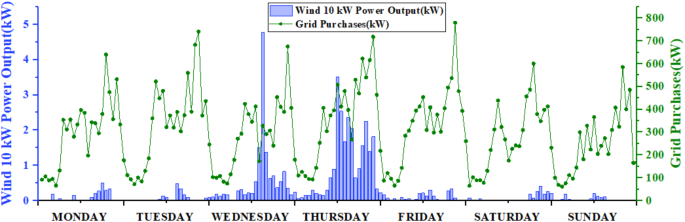
Hour-Wise Energy Demand Distribution for Wind with Grid Configuration.
Type 3- solar PV with grid and battery configuration
Based on NPC and LCOE, the Solar with Battery and Grid configuration has an NPC of $ 288,755 an LCOE of $ 0.0087 and an operating cost ($) of $ 5826. The Solar PV-battery-utility grid system offers the most economical energy, maintenance, and operating costs. This Solar Battery with Grid configuration design guarantees the lowest possible operating costs among all the different combinations. Figure 11 shows solar PV with grid and battery design with 22,439 kW of solar power.
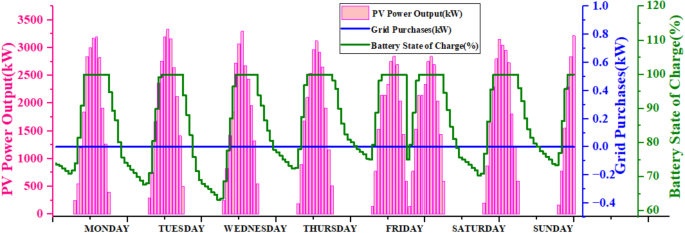
Hour-wise energy demand distribution for solar PV With grid and battery configuration.
Type 4 wind with grid and battery configuration
The wind energy configuration with grid and battery energy storage has an NPC of $ 1852,845 an LCOE $ 0.056 and an operating cost ($) of $ 86,636. In the wind energy configuration with grid and battery, wind power produced 9,013 kW grid power bought 184 kW are shown in Fig. 12.
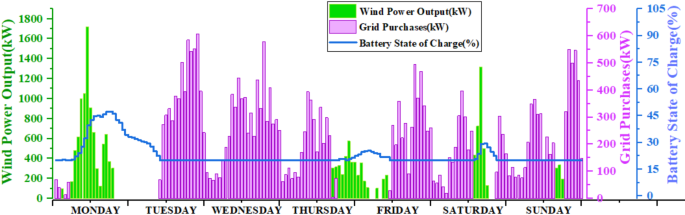
Hour-wise energy demand distribution for wind with grid and battery configuration.
Type 5- solar PV wind with grid configuration
The Solar Photo Voltaic system incorporated with Wind and grid system is shown in Fig. 13, which has an NPC of $ 1359,555 an LCOE of $ 0.041 and an operating cost ($) of $ 92,507. It uses solar power to produce 23,414 kilowatts, wind power generated is 674.35 kW and electricity obtained from the grid to amount to 2,754 kilowatts. This arrangement employs renewable source of energy that are integrated with the electrical power grid, resulting in a sustainable system.
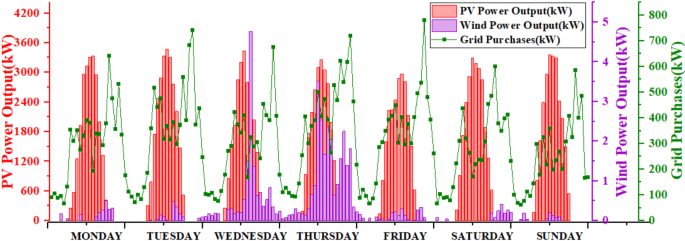
Hour-wise energy demand distribution for solar PV, wind with grid configuration.
Type 6- solar PV wind with grid and battery configuration
A solar, grid, wind, and battery energy storage system with an NPC of $ 288,755 an LCOE of $ 0.0087, and an operating cost ($) of $ 6,001 is the final design that was taken into consideration for optimization. The photovoltaic solar power system with an electrical grid and battery is considered the most cost-effective and budget-friendly design, as established by NPC and LCOE.
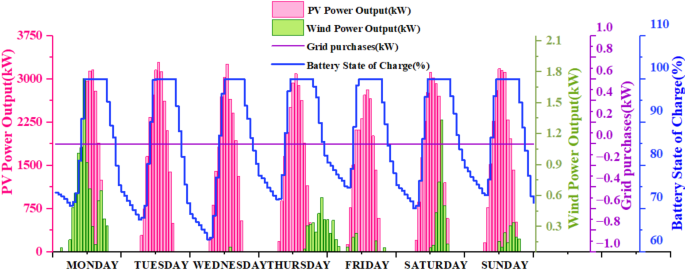
Hour-wise energy demand distribution for solar PV, wind with grid and battery configuration.
The current system consists of a solar module that is combined with a Battery Storage System, and it also includes a converter that is specifically developed for integration with the grid. As a result, the net present value of the system is $24.1 million, and the energy cost is $0.724 per kWh. Figure 14 illustrates the solar PV Wind integrated with grid and battery energy storage system, which generates 22,195 kilowatts of power through the use of solar energy, 9 kilowatts of electricity through the wind.
Sensitivity analysis
The sensitivity analysis shown in Table 7 indicates that Fuzzy EMS consistently achieves the lowest LCOE (0.000237 $/kWh) and the highest NPC ($1,288,755.00) at multiple variations, indicating its superior cost-effectiveness. Solar and wind power variations have minimal impact on LCOE, but wind tends to be more stable. Battery capacity changes do not significantly influence cost trends, but fluctuations in grid tariffs and load demand cause substantial LCOE variations, emphasizing the importance of demand-side energy management. At high solar and wind power variations, Fuzzy EMS dominates, ensuring minimal LCOE despite its higher investment cost. Load demand fluctuations have the most significant impact on LCOE, suggesting that energy efficiency measures and optimized load management could further enhance cost savings.
The sensitivity of the proposed FLC EMS to computational parameters substantially affects its accuracy, convergence, and computational efficiency. Time step size sensitivity influences LCOE by 5–10%. Population size (PSO, GA) and mutation rate (GA) affect convergence, resulting in fluctuations in NPC and LCOE. Additionally, discount rate sensitivity, with variations of ± 20%, causes NPC changes of 10–20% and LCOE fluctuations of 15–30%. The proposed EMS effectively handles the uncertainties related to renewable energy generation, load demand fluctuations, and system dynamics. Sensitivity analysis validates the robustness of the proposed approach, showcasing the system’s capacity to sustain stability and efficiency in the face of uncertain operating conditions. Instead of relying on fixed thresholds, FLC processes imprecise inputs and makes adaptive decisions based on predefined rules. This improves system resilience, ensures energy efficiency, and maintains grid stability in dynamic conditions. Table 8 compares the proposed work with the existing Literatures.