Share Facebook Twitter LinkedIn Pinterest Bluesky Threads Recipe analytics for Claire Saffitz’s “Dessert Person” [OC] Posted by actionpotential_
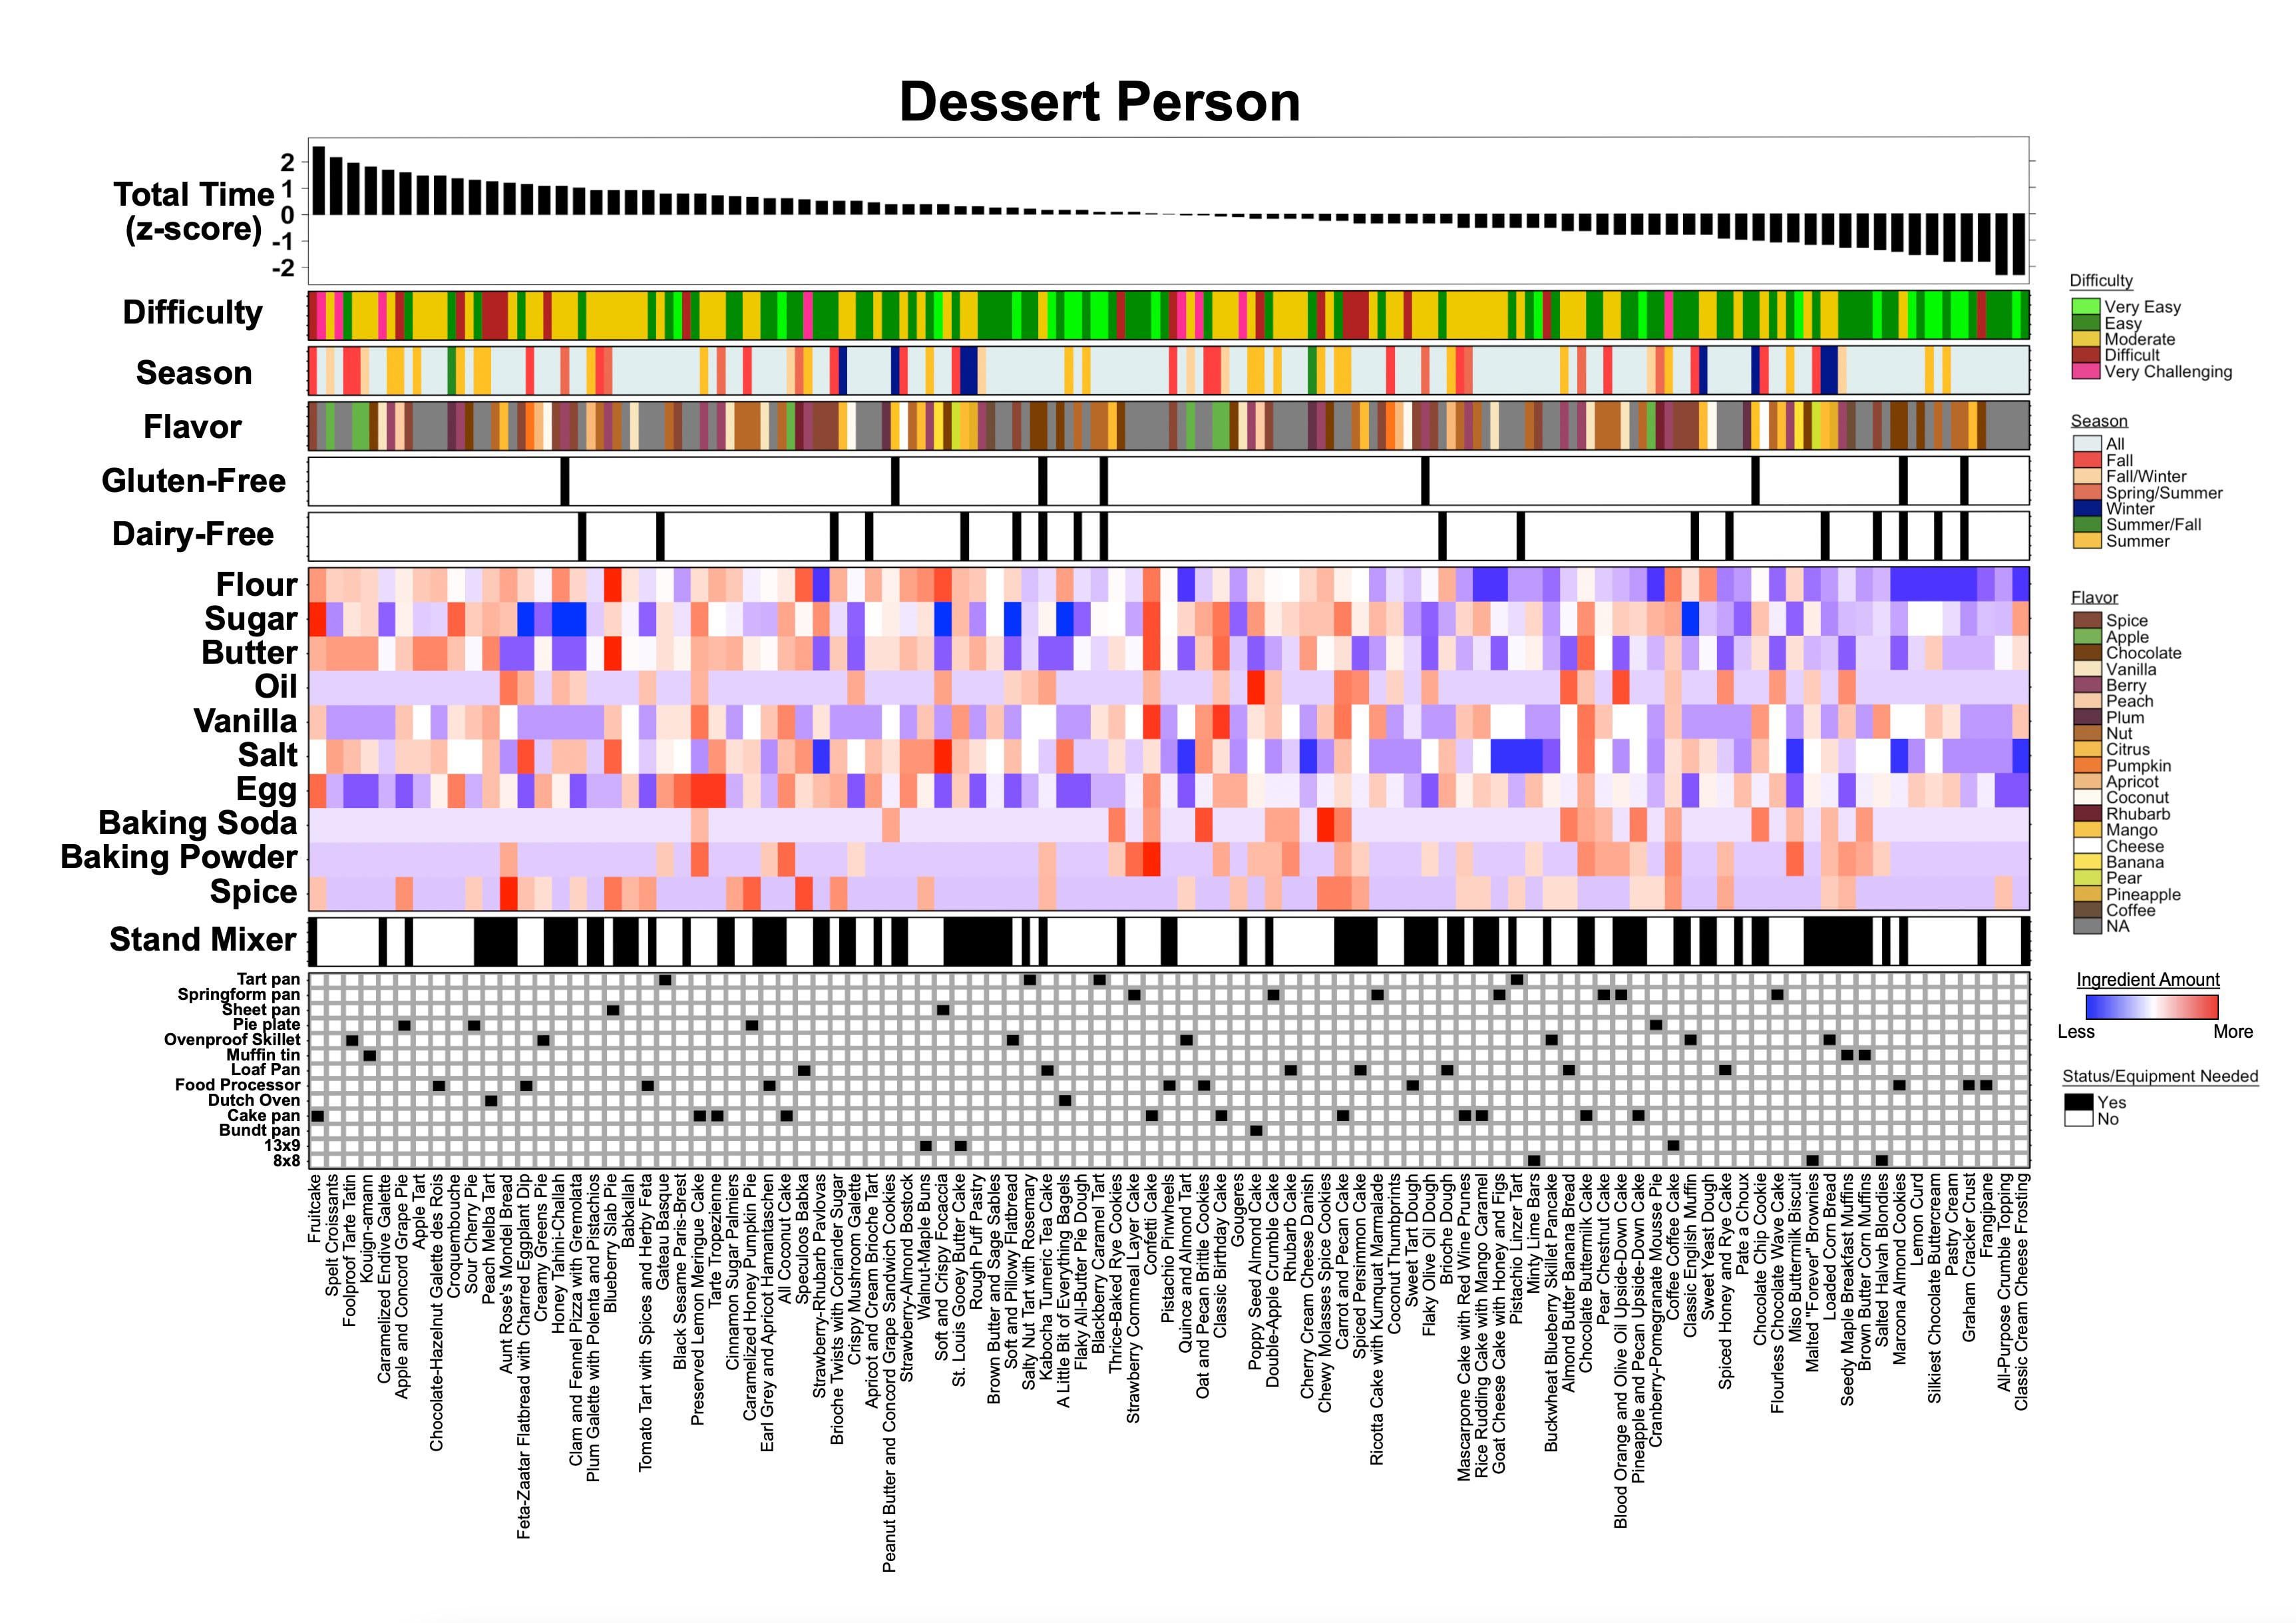
actionpotential_ on March 26, 2025 12:53 am Data was collected using the recipes from Claire Saffitz’s Dessert Person. Data visualization was performed in R.
bweasels on March 26, 2025 12:54 am Is that using ComplexHeatmap? If so – could you share the plotting code? The bottom grid annotation is super nifty!
dim_eer on March 26, 2025 1:08 am really cool! it’s kinda hard to see the difficulty of each individual recipe, but really cool nonetheless
DatesAndCornfused on March 26, 2025 1:41 am Claire Saffitz makes me feel Lemon-Zesty This image makes me feel Stressy-Depressy

![Recipe analytics for Claire Saffitz’s “Dessert Person” [OC]](https://www.byteseu.com/wp-content/uploads/2025/03/khg81z4ikxqe1-1536x1085.jpeg "Recipe analytics for Claire Saffitz’s “Dessert Person” [OC]")
10 Comments
Data was collected using the recipes from Claire Saffitz’s Dessert Person. Data visualization was performed in R.
This is very thorough, but idk if it’s pretty.
Is that using ComplexHeatmap? If so – could you share the plotting code? The bottom grid annotation is super nifty!
This is why I love the internet
Fascinating! Did you post on r/dessertperson as well??
really cool! it’s kinda hard to see the difficulty of each individual recipe, but really cool nonetheless
How did you weight having to temper chocolate?
Claire is such a baller. I have learned so much from her.
Claire Saffitz makes me feel Lemon-Zesty
This image makes me feel Stressy-Depressy
Do I look like a barcode reader to you, sir or madam?