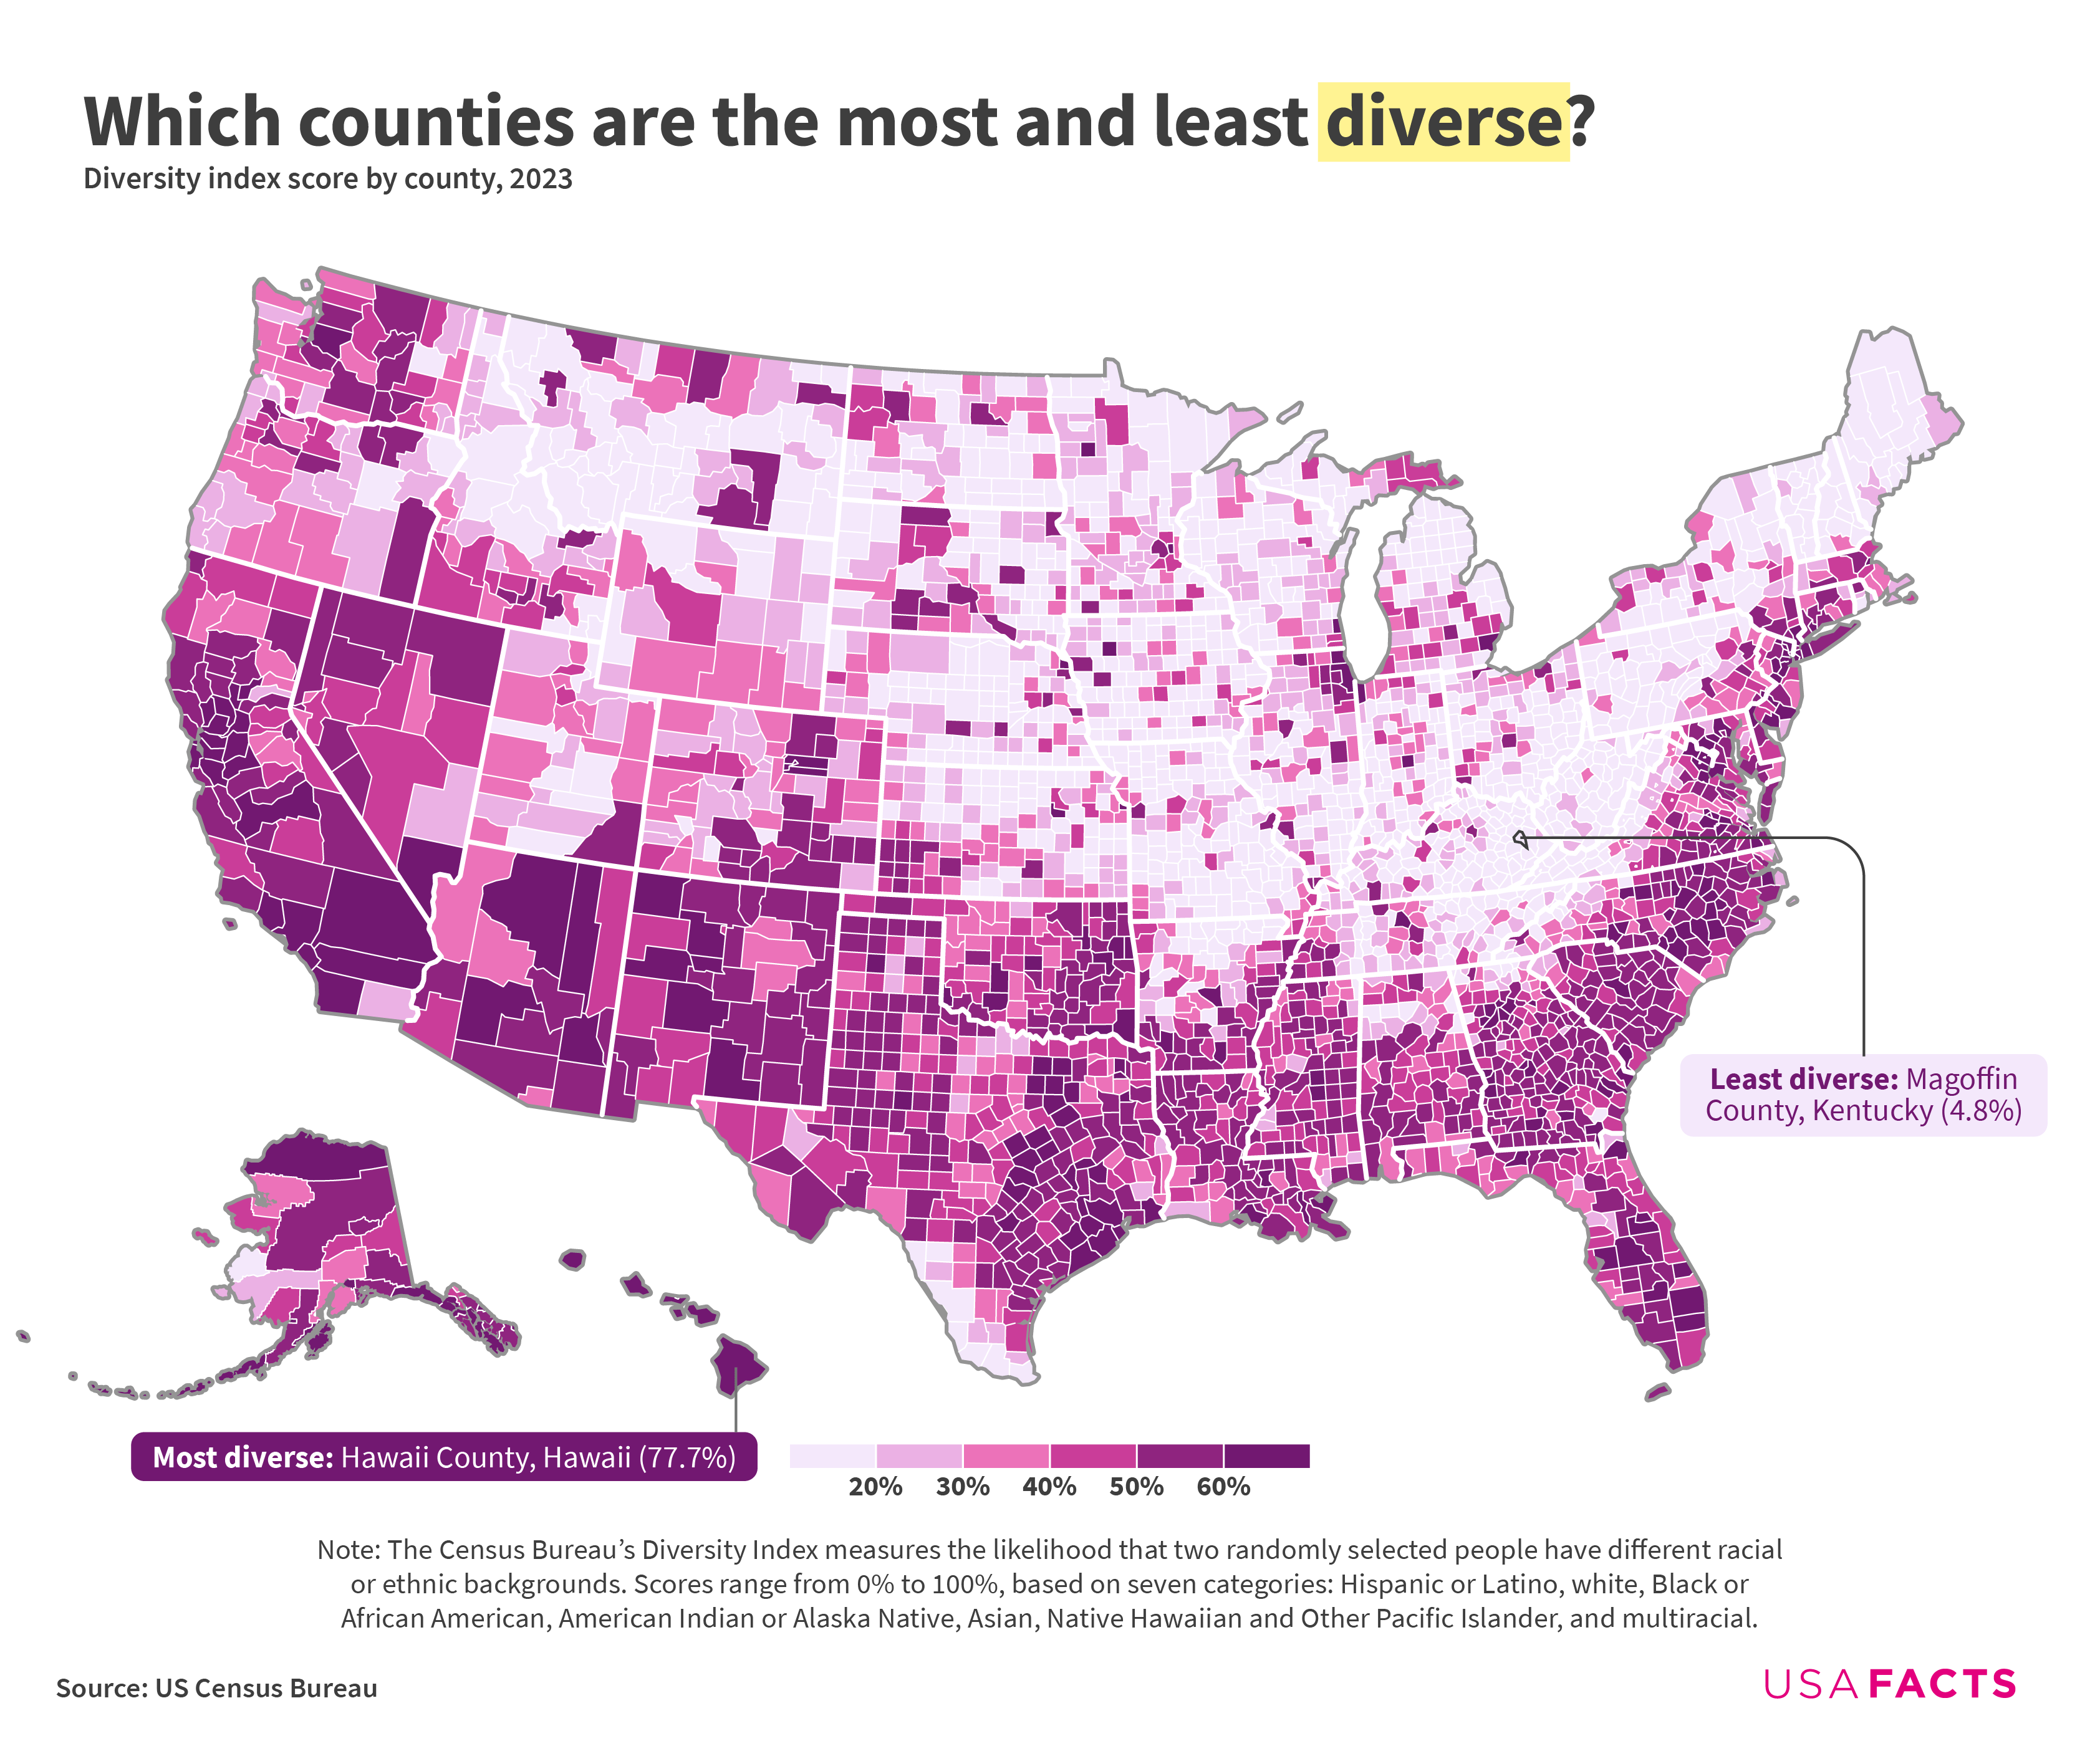
Note on the Diversity Index: The Census Bureau’s Diversity Index measures the likelihood that two randomly selected people have different racial or ethnic backgrounds. Scores range from 0% to 100%, based on seven categories: Hispanic or Latino, white, Black or African American, American Indian or Alaska Native, Asian, Native Hawaiian and Other Pacific Islander, and multiracial.
There’s no perfect way to measure racial and ethnic diversity, but the method used by the Census Bureau is a start. Here’s how they describe it:
>We use the Diversity Index (DI) to measure the probability that two people chosen at random will be from different race and ethnicity groups. The DI is bounded between 0 and 1. A 0-value indicates that everyone in the population has the same racial and ethnic characteristics. A value close to 1 indicates that everyone in the population has different racial and ethnic characteristics. We have converted the probabilities into percentages to make them easier to interpret. In this format, the DI tells us the chance that two people chosen at random will be from different racial and ethnic groups—a 61.1% chance in the United States in 2020.
The seven races and ethnicities included in this measure are: Hispanic or Latino, white, Black or African American, American Indian or Alaska Native, Asian, Native Hawaiian and Other Pacific Islander, and multiracial.
At the county level, four of the top 10 most diverse counties are in Hawaii: Hawaii County (77.7%), Maui County (76.8%), Kauai County (76.5%), and Kalawao County (76.2%).
The other counties with the highest DI scores were the Aleutians West Census Area, Alaska (76.3%); Fort Bend County, Texas (75.8%); Queens County, New York (75.6%); Solano County, California (75.0%); Gwinnett County, Georgia (74.6%); and Alameda County, California (74.2%).
The lowest-scoring counties were Magoffin County, Kentucky (4.8%); Holmes County, Ohio (5.0%); McPherson County and Arthur Counties, Nebraska (5.1 and 5.2%); and Dickenson County, Virginia (5.3%).
At the state level, Hawaii had the highest overall DI score (76.1%), followed by California (69.0%), and Nevada (68.4%). The three states with the lowest scores were Maine (15.6%), Vermont (16.2%), and West Virginia (17.1%).
Damn non-white people must hate the Appalachian mountains
botany_bae on
Blue Ridge mountains doin’ some work right there.
silent_porcupine123 on
Non American here, I thought the South was stereotyped as more conservative and racist and therefore less diverse?
jrdubbleu on
This is gorgeous. Nice work
Reloaded_M-F-ER on
Someone needs to diversify New England, man. Either way, its better to have more diversity there than in the conservative south imo.
punarob on
Not surprised as most people here are mixes of several ethnicities due to historic different waves of immigration which brought agricultural (sugar cane) workers from China, Japan, the Phillipines, Puerto Rico, Portugal, and Mexico (cowboys), and more recently Caucasians and Micronesians.
powerlevelhider on
Yeah lets let places with no immigrants decide if the country welcomes immigrants.
ayebrade69 on
My hometown is Salyersville in Magoffin County lmao
Sitroc on
Love seeing my beautiful commonwealth leading in at least one category 💀
Hood_Harmacist on
i understand the limitations of everything, but it’s crazy to reduce the thousands of different cultures into just 7
backcountry57 on
As a Mainer I am surprised I was thinking we were way less diverse than that.
courtFTW on
No one talks about how rough it is moving from a dark purple place to the palest lavender place 😩

![The most and least diverse counties in the US [OC]](https://www.byteseu.com/wp-content/uploads/2025/03/46eflg15c2re1-1536x1274.png "The most and least diverse counties in the US [OC]")
14 Comments
Source: [US Census Bureau](https://www.census.gov/data/tables/time-series/demo/popest/2020s-counties-detail.html)
Tools: Datawrapper, Illustrator
Note on the Diversity Index: The Census Bureau’s Diversity Index measures the likelihood that two randomly selected people have different racial or ethnic backgrounds. Scores range from 0% to 100%, based on seven categories: Hispanic or Latino, white, Black or African American, American Indian or Alaska Native, Asian, Native Hawaiian and Other Pacific Islander, and multiracial.
More data [here](https://usafacts.org/articles/where-has-diversity-changed-in-recent-years/)
There’s no perfect way to measure racial and ethnic diversity, but the method used by the Census Bureau is a start. Here’s how they describe it:
>We use the Diversity Index (DI) to measure the probability that two people chosen at random will be from different race and ethnicity groups. The DI is bounded between 0 and 1. A 0-value indicates that everyone in the population has the same racial and ethnic characteristics. A value close to 1 indicates that everyone in the population has different racial and ethnic characteristics. We have converted the probabilities into percentages to make them easier to interpret. In this format, the DI tells us the chance that two people chosen at random will be from different racial and ethnic groups—a 61.1% chance in the United States in 2020.
The seven races and ethnicities included in this measure are: Hispanic or Latino, white, Black or African American, American Indian or Alaska Native, Asian, Native Hawaiian and Other Pacific Islander, and multiracial.
At the county level, four of the top 10 most diverse counties are in Hawaii: Hawaii County (77.7%), Maui County (76.8%), Kauai County (76.5%), and Kalawao County (76.2%).
The other counties with the highest DI scores were the Aleutians West Census Area, Alaska (76.3%); Fort Bend County, Texas (75.8%); Queens County, New York (75.6%); Solano County, California (75.0%); Gwinnett County, Georgia (74.6%); and Alameda County, California (74.2%).
The lowest-scoring counties were Magoffin County, Kentucky (4.8%); Holmes County, Ohio (5.0%); McPherson County and Arthur Counties, Nebraska (5.1 and 5.2%); and Dickenson County, Virginia (5.3%).
At the state level, Hawaii had the highest overall DI score (76.1%), followed by California (69.0%), and Nevada (68.4%). The three states with the lowest scores were Maine (15.6%), Vermont (16.2%), and West Virginia (17.1%).
It’s worth noting that a state (or country) score tells us about diversity overall but not about the specific racial and ethnic breakdowns, which vary widely. [This chart](https://www.datawrapper.de/_/9EfAR/?v=7) breaks down race and ethnicity at the state level, and you can select individual states to view county-level data using [this Census tool](https://www.census.gov/library/visualizations/interactive/racial-and-ethnic-diversity-in-the-united-states-2010-and-2020-census.html) if you’re curious.
Damn non-white people must hate the Appalachian mountains
Blue Ridge mountains doin’ some work right there.
Non American here, I thought the South was stereotyped as more conservative and racist and therefore less diverse?
This is gorgeous. Nice work
Someone needs to diversify New England, man. Either way, its better to have more diversity there than in the conservative south imo.
Not surprised as most people here are mixes of several ethnicities due to historic different waves of immigration which brought agricultural (sugar cane) workers from China, Japan, the Phillipines, Puerto Rico, Portugal, and Mexico (cowboys), and more recently Caucasians and Micronesians.
Yeah lets let places with no immigrants decide if the country welcomes immigrants.
My hometown is Salyersville in Magoffin County lmao
Love seeing my beautiful commonwealth leading in at least one category 💀
i understand the limitations of everything, but it’s crazy to reduce the thousands of different cultures into just 7
As a Mainer I am surprised I was thinking we were way less diverse than that.
No one talks about how rough it is moving from a dark purple place to the palest lavender place 😩