Bored on a Thursday afternoon.
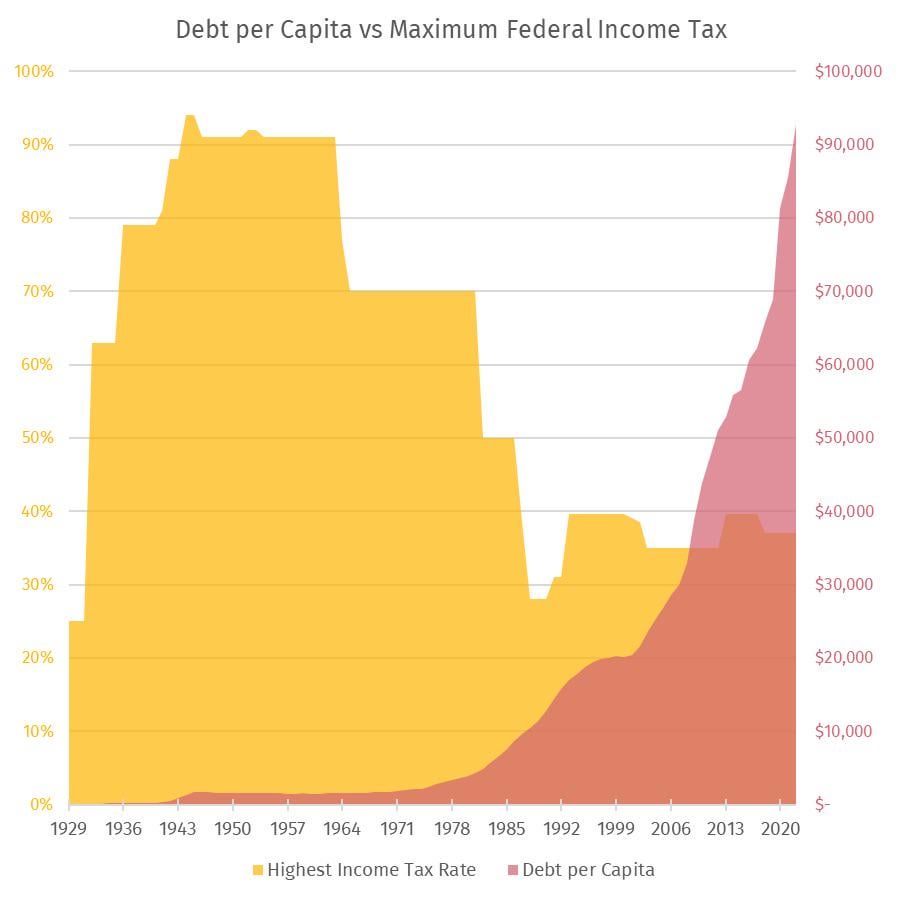
Population: Statista.com
Debt: fiscal data.treasury.gov
Tax Rates: tax foundation.org
Posted by Worried-Rough-338

Bored on a Thursday afternoon.
Population: Statista.com
Debt: fiscal data.treasury.gov
Tax Rates: tax foundation.org
Posted by Worried-Rough-338
25 Comments
The answer is probably neither, and I also notice that one of these measures would significantly benefit from being adjusted for inflation.
Profits for billionaires today, and deep debt for future generations tomorrow. That is the GOP plan.
is the debt per capital done with inflation-adjusted dollars?
This is obviously not causal evidence in any way, shape or form – the question itself feels disingenuous.
Maybe include direct links to the data sources rather than just the sites you got them from. That way if someone wants to investigate an aspect of it, they don’t have to start with an easter egg hunt.
As always, this deserves a link to [Spurious Correlations](https://www.tylervigen.com/spurious-correlations).
If you wanted to compare, compare spending in 1950 vs spending in 2020, corrected for inflation. Then use actual intake of funds from the top 1%, not the marginal percentage. There were a lot more loopholes back then. You’ll be able to see where the gulfs between intake and spending start actually growing.
Also, you’re comparing something per capita from right when the baby boom started to when we hit a big population bottleneck. Our population has not had steady growth.
Debt is high because the concept of debt has changed entirely under our current currency/economic system. The US is in high debt, but because of the way modern national debts work for countries like the US, it is almost meaningless. National/international governmental debt doesn’t operate like a normal person’s debt, or even like a business/corporate debt. It’s an entirely different animal, and there is really no current reason why a country like the US needs to be especially concerned about the bulk of the debt they hold. It’s just a number, effectively.
Obv not a direct causation, but the lowering of the top tax rate coincides with the Reagan era.
Not only are the debt numbers misleading, using the top income tax rate on paper is also misleading. Before the reforms in the 80s, rates were higher, but there were more deductions. A much less misleading measure is tax collection as a fraction of GDP, which is far closer to stable over time.
Another factor is that government revenues and expenses work differently than businesses. Yes, governments choose how much to spend, but unlike businesses, they _also_ choose how much revenue to raise and how to raise it. So incurring more debt relative to tax income for a government is more like a business choosing more debt financing relative to raising capital through equity than it is to a business facing falling revenue from operations. It’s a strategic choice with a lot more moving parts than just “who is paying their fair share.”
Oooof, a lot of angry Americans commenting here. Whether there is a correlation or not, the data is interesting to see. Seems like most of American wealth is based on debt they can’t afford. Plenty of downvotes coming my way I’m sure just for not being butthurt about a graph.
Income tax is only one type of tax increase. For example yesterday we saw one of the largest tax increases in decades with tariff tax increases.
It will change spending a ton but wouldn’t be reflected in the data on this chart.
Privatize profits…
Socialize losses…
SMH
We have Public Debt, because we tell people we will pay them interest, risk free. The only reason we sell bonds, at all, is so central banks can maintain a non-zero overnight interest rate, no matter if we have a quadrillion in deficit or a trillion in surplus. They are sold for monetary reasons, not fiscal.
You can get in on the action yourself at [www.treasurydirect.gov](http://www.treasurydirect.gov)
Therefore, they are obviously not correlated or causative.
Nixon taking the US off the gold standard in 1971 lines up nicely. That paved the way for printing money and turning it the dollar into a pure fiat currency.
This post having upvotes is very funny. It’s not beautiful or interesting. And it has a biased/leading question in the title. Never change reddit…
This plot is a pretty poor way to even check for correlation.
I’d plot the rate versus annual percent increase as scatter plot.
This is extremely dishonest because it fails to use inflation adjusted GDP per capita. Inflation alone would cause the debt/capita to increase exponentially, all else being constant.
But what was the return on that debt? How much has the economy expanded vs when the government took 90%? The private sector has churned out massive economic gains, no?
No one going to mention the fact that even though some people had a 90% tax rate back in the day, they rarely if ever paid anything near that?
Generally not good idea to compare unitless numbers with units. In fact numbers with units should be avoided wherever possible
This is a deceiving post. That 90% tax rate was not for low and middle class, it was for top earners.
Hear me out: A top marginal tax rate of 100%, with a tax credit for every job created by the “job creators”
Correlation.
Debt is caused by increased spending.
Tax revenue as a fraction of GDP is famously very insensitive to top tax rates, because when top rates are high, people simply don’t pay them.
Now look at federal revenue as a percentage of GDP and federal outlays as a percentage of GDP during that time frame.
Revenue changed very little. Since the 1980s, outlays have gone from 18% to 22%. Non defense outlays have gone from 9% to 18%.
Are these trends even correlated? Doesn’t look like it to me. Did you calculate r?