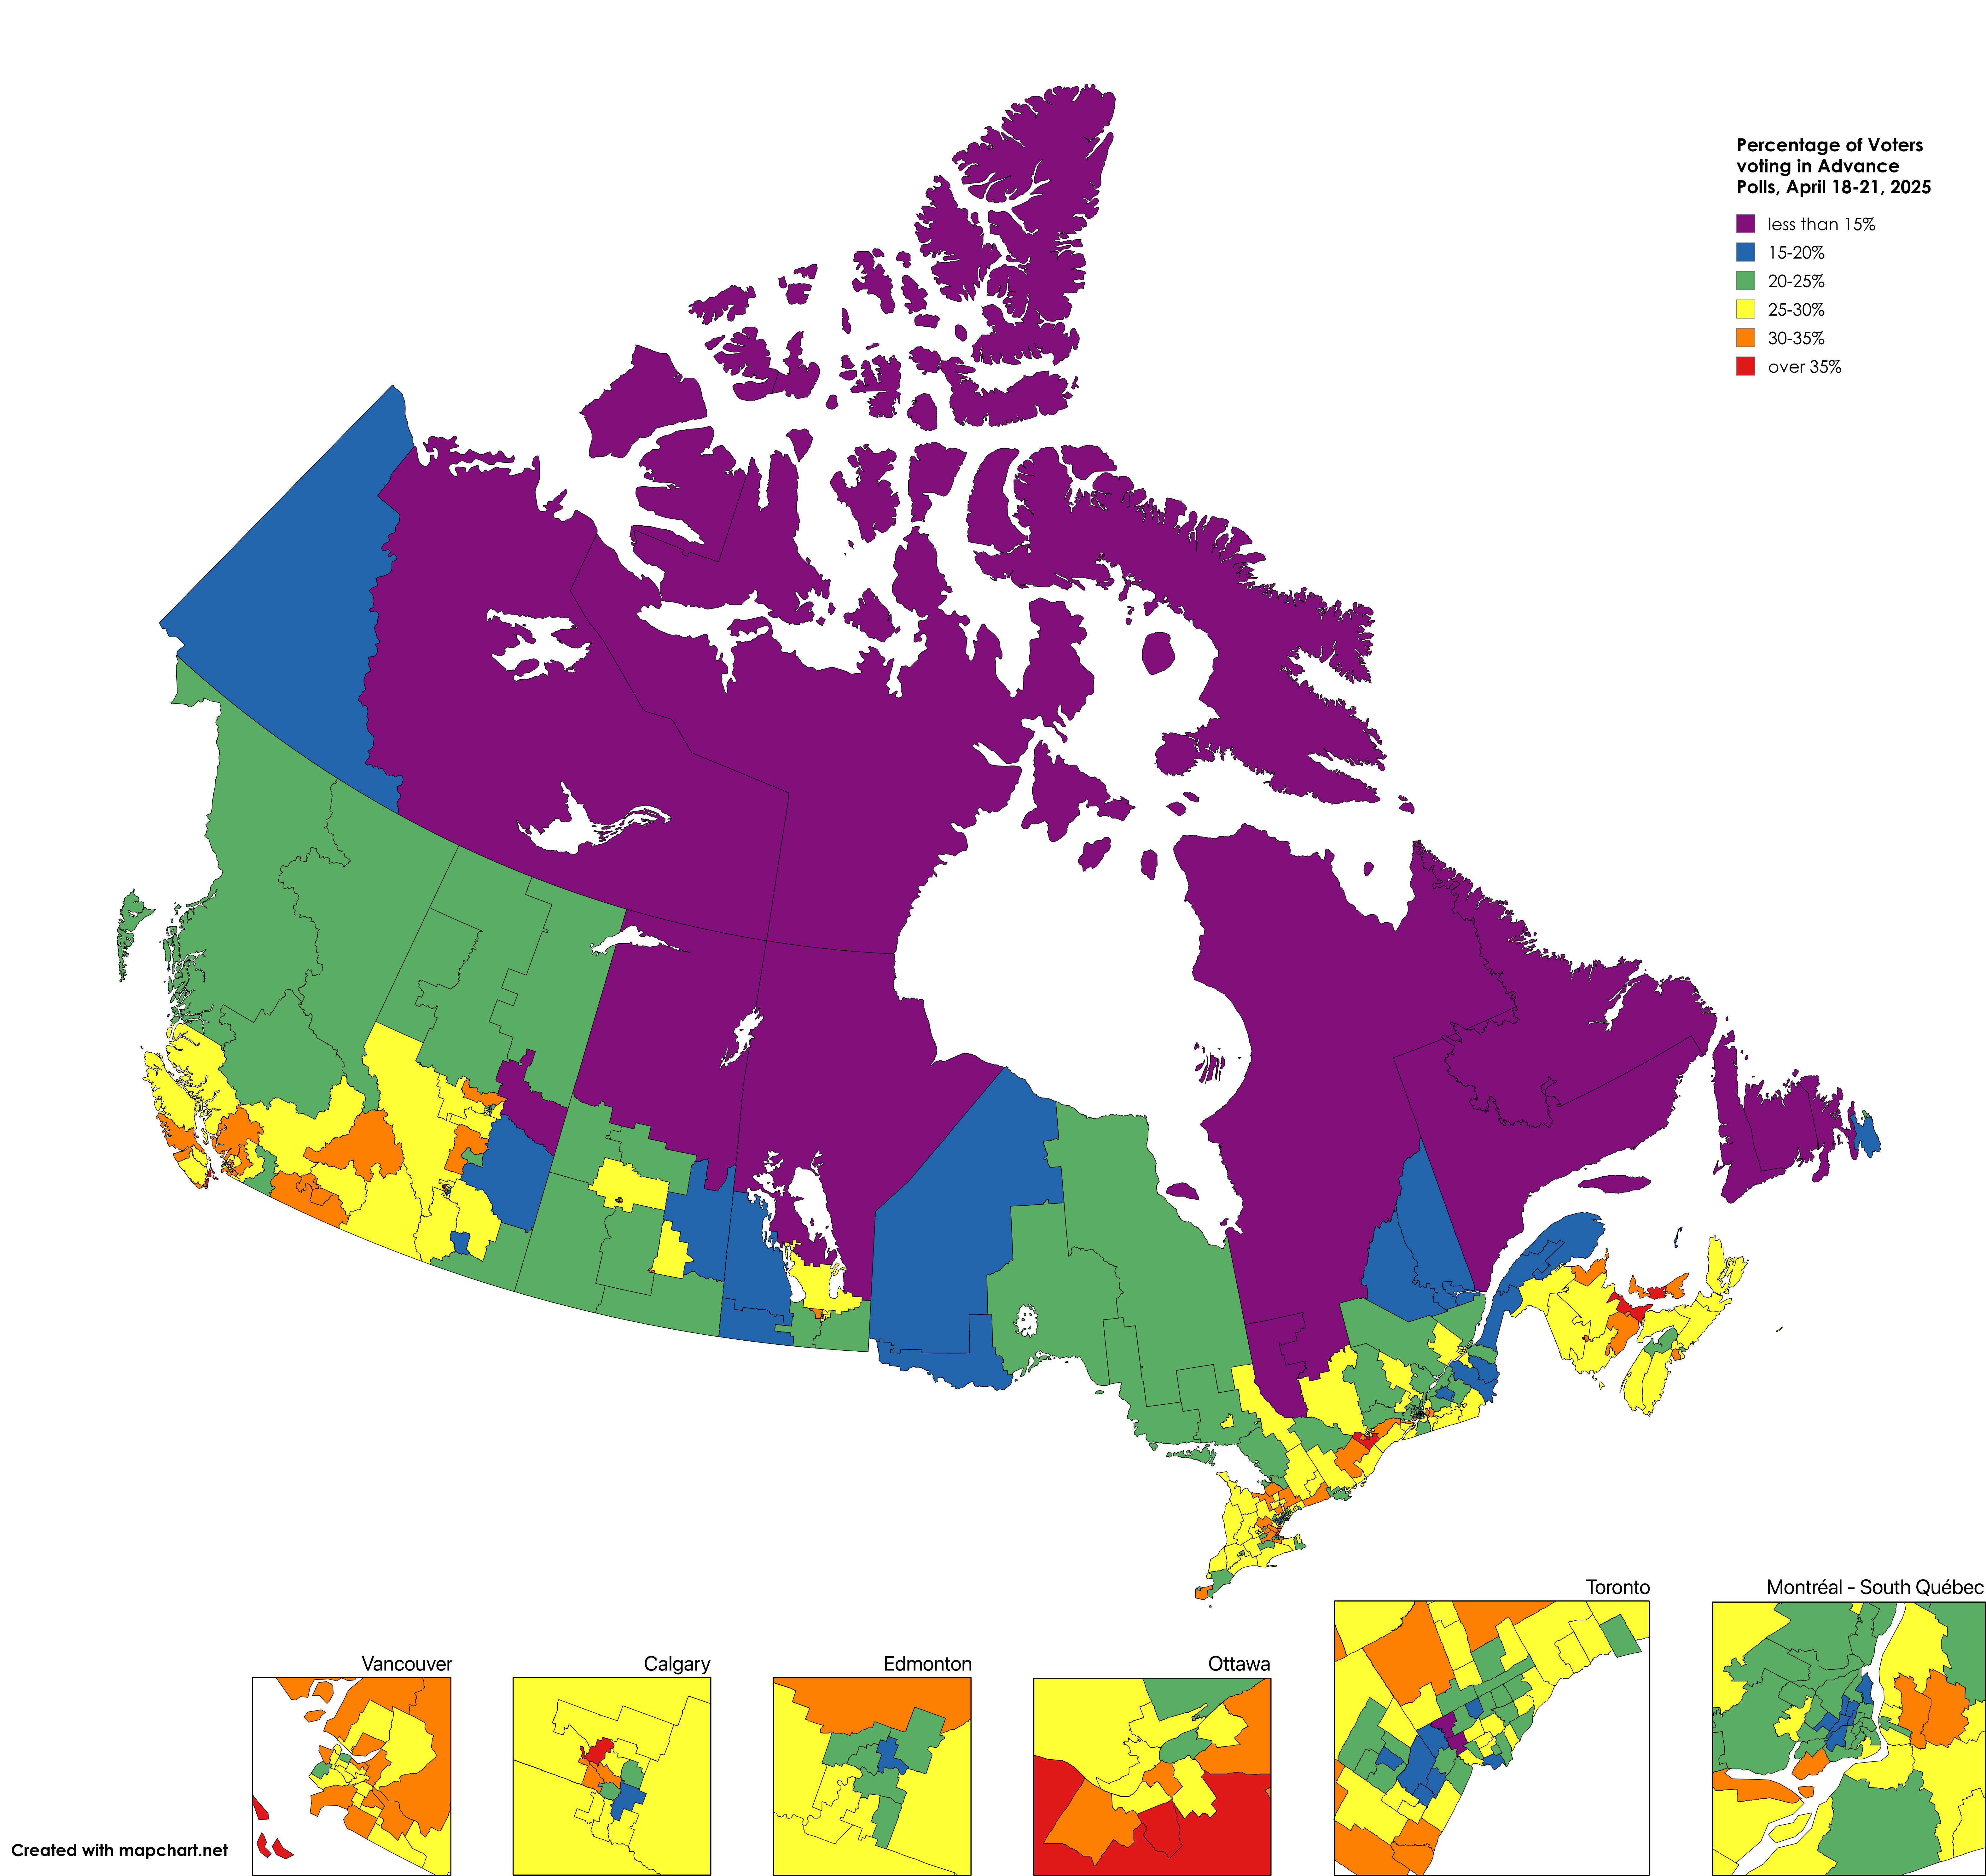
Data is the percentage of voters in each riding who turned out to vote at Advance Polls, April 18-21. This does not include votes by mail or special ballot. Election Day will be on Monday, April 28, 2025.
My percentage is based on number of voters in the riding, not general population. Population numbers include non-voters, like those under 18 and non-citizens.
I know who I voted for, but goddamn, what I would give to keep the level of voter engagement we’re currently seeing.
It shouldn’t take an existential threat to get people out to the polls like this.
herotonero on
Correlation of population density and participation is notable….

![Advance Polls Voter Turnout, April 18-21, Canadian Federal Election 2025 [OC]](https://www.byteseu.com/wp-content/uploads/2025/04/8n2b9sued1xe1-1536x1451.png "Advance Polls Voter Turnout, April 18-21, Canadian Federal Election 2025 [OC]")
3 Comments
Data is the percentage of voters in each riding who turned out to vote at Advance Polls, April 18-21. This does not include votes by mail or special ballot. Election Day will be on Monday, April 28, 2025.
Source: Elections Canada Advance Poll data: [https://elections.ca/content.aspx?section=med&document=ge45_advpol&lang=e](https://elections.ca/content.aspx?section=med&document=ge45_advpol&lang=e)
Had to manually get the number of electors on Election Canada’s list from each individual riding profile. For example, Calgary Centre: [https://www.elections.ca/Scripts/vis/Profile?L=e&ED=48004&EV=62&EV_TYPE=1&PROV=AB&PROVID=48&QID=-1&PAGEID=29](https://www.elections.ca/Scripts/vis/Profile?L=e&ED=48004&EV=62&EV_TYPE=1&PROV=AB&PROVID=48&QID=-1&PAGEID=29)
Tool: Made with Mapchart.
My percentage is based on number of voters in the riding, not general population. Population numbers include non-voters, like those under 18 and non-citizens.
Edit: [Here is the CSV with my data](https://limewire.com/d/Emylw#bHz3T2Jb84) – have fun!
I know who I voted for, but goddamn, what I would give to keep the level of voter engagement we’re currently seeing.
It shouldn’t take an existential threat to get people out to the polls like this.
Correlation of population density and participation is notable….
I’m definitely noting it